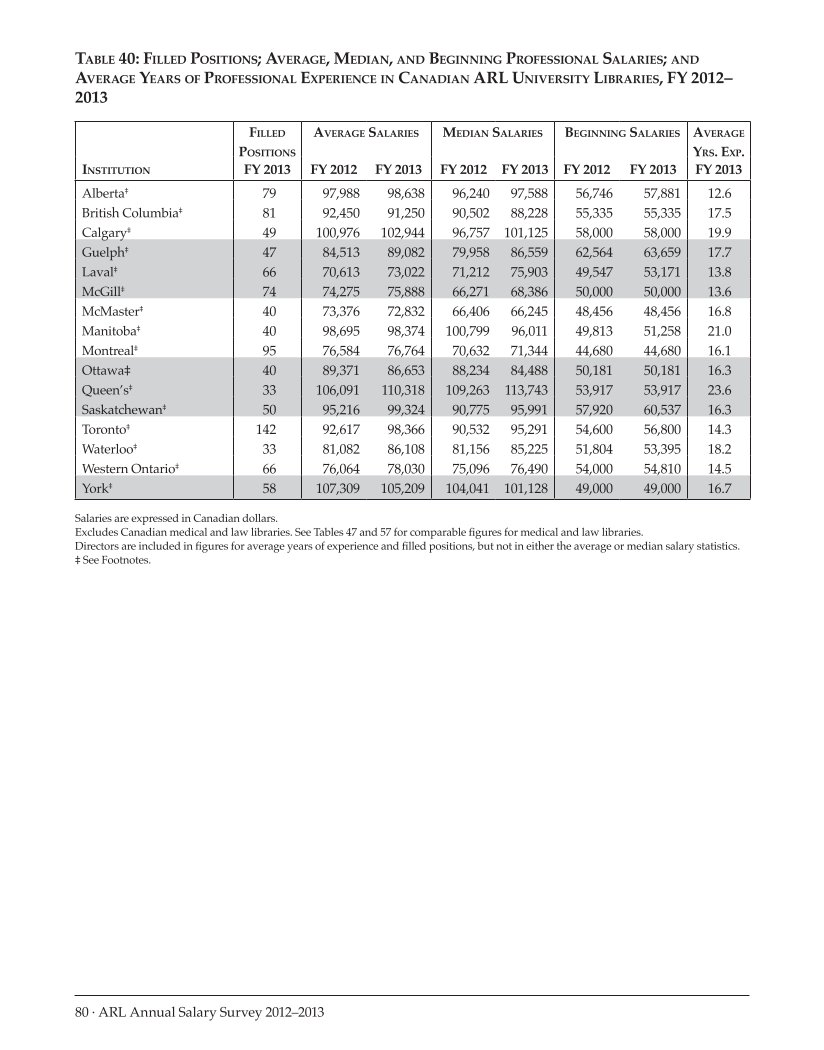
80 · ARL Annual Salary Survey 2012–2013 Table 40: Filled Positions Average, Median, and Beginning Professional Salaries and Average Years of Professional Experience in Canadian ARL University Libraries, FY 2012– 2013 Filled Positions Average Salaries Median Salaries Beginning Salaries Average Yrs. Exp. Institution FY 2013 FY 2012 FY 2013 FY 2012 FY 2013 FY 2012 FY 2013 FY 2013 Alberta‡ 79 97,988 98,638 96,240 97,588 56,746 57,881 12.6 British Columbia‡ 81 92,450 91,250 90,502 88,228 55,335 55,335 17.5 Calgary‡ 49 100,976 102,944 96,757 101,125 58,000 58,000 19.9 Guelph‡ 47 84,513 89,082 79,958 86,559 62,564 63,659 17.7 Laval‡ 66 70,613 73,022 71,212 75,903 49,547 53,171 13.8 McGill‡ 74 74,275 75,888 66,271 68,386 50,000 50,000 13.6 McMaster‡ 40 73,376 72,832 66,406 66,245 48,456 48,456 16.8 Manitoba‡ 40 98,695 98,374 100,799 96,011 49,813 51,258 21.0 Montreal‡ 95 76,584 76,764 70,632 71,344 44,680 44,680 16.1 Ottawa‡ 40 89,371 86,653 88,234 84,488 50,181 50,181 16.3 Queen’s‡ 33 106,091 110,318 109,263 113,743 53,917 53,917 23.6 Saskatchewan‡ 50 95,216 99,324 90,775 95,991 57,920 60,537 16.3 Toronto‡ 142 92,617 98,366 90,532 95,291 54,600 56,800 14.3 Waterloo‡ 33 81,082 86,108 81,156 85,225 51,804 53,395 18.2 Western Ontario‡ 66 76,064 78,030 75,096 76,490 54,000 54,810 14.5 York‡ 58 107,309 105,209 104,041 101,128 49,000 49,000 16.7 Salaries are expressed in Canadian dollars. Excludes Canadian medical and law libraries. See Tables 47 and 57 for comparable figures for medical and law libraries. Directors are included in figures for average years of experience and filled positions, but not in either the average or median salary statistics. ‡ See Footnotes.
Help


