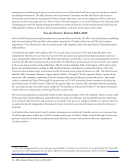
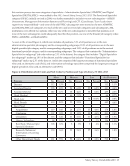
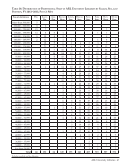
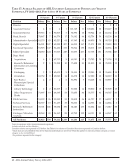
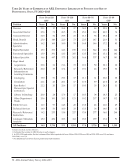
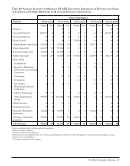
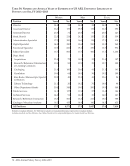
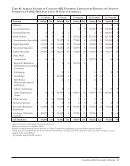
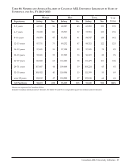
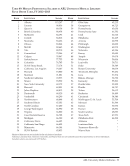
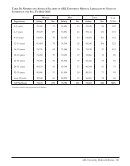
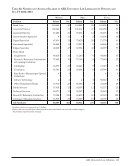
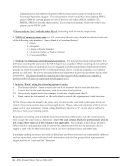
20 · ARL Annual Salary Survey 2012–2013 Figure 6d: Average Salary by Percentile in Libraries with Five Step Rank Structures, FY 2012–2013 No. of Staff Low 25th Percentile Median 75th Percentile High Librarian 1 227 29,890 47,544 54,000 61,585 97,901 Librarian 2 312 40,000 53,933 60,589 68,756 108,520 Librarian 3 468 43,802 63,018 73,853 83,286 131,336 Librarian 4 271 52,080 76,587 86,198 99,840 170,000 Librarian 5 111 65,014 94,627 104,985 121,224 160,000 Inflation Effect Tables 2 and 6 reveal changes in beginning professional and median salaries as reported by both university and nonuniversity research libraries, as well as the US Bureau of Labor’s Cost of Living Index (CPI-All Urban Consumers). Table 3 is similar to Table 2, but reports data only on US libraries. Table 4 shows trend data for Canadian libraries and compares them to the changes in the Canadian Consumer Price Index (Consumer Price Index for Canada, all-items, not seasonally adjusted). Tables 2, 3, and 4 include law and medical library staff in ARL university libraries. Continuing the trend from 2011–2012, Tables 3 and 4 indicate that the purchasing power of professionals in the United States did not keep pace with inflation, while the purchasing power of their Canadian counterparts did keep pace with inflation. The median salary for US ARL university libraries in 2012 increased by 1.2% to $67,257 (see Table 3). This modest salary increase was almost on par with the rebounding economy, which saw the US CPI increase by 1.4%% (see Table 3).7 In contrast, Canadian salaries (reported in Canadian dollars) surpassed inflation by 0.5 percentage points: the Canadian CPI increased 1.3%, while median salaries in Canadian university libraries increased by 1.8% to $87,120 (Canadian dollars, see Table 4).8 The median beginning salary (BPS) for university ARL librarians increased to $47,000 in 2012–2013 (see Table 2). Table 6 shows that median salaries for nonuniversity librarians increased to $95,158, while beginning salaries decreased to $46,953 in 2012–2013. Readers are reminded that these data reflect only salaries, and that there are other compensation issues which may have influenced the pattern of salaries in various institutions. In addition, a highly standardized structure for capturing data has been used, which may portray results in a way that cannot be fully representative of a local situation. Martha Kyrillidou Shaneka Morris Association of Research Libraries 7 CPI data retrieved from the U.S. Department of Labor, Bureau of Labor Statistics’ Consumer Price Index-All Urban Consumers (U.S. All items, 1982-84=100 -CUUR0000SA0) available online at http://www.bls.gov/data/. 8 The source for Canadian CPI data is Table 5: The Consumer Price Index for Canada (All-Items, Not Seasonally Adjusted, Historical Data) published in The Daily, a Statistics Canada publication, available online at http://www.statcan.gc.ca/pub/62- 001-x/2013002/t040-eng.htm.
Help