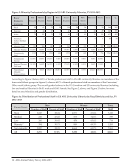
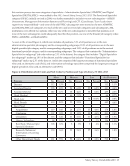
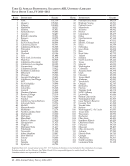
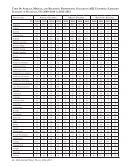
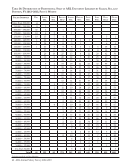
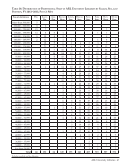
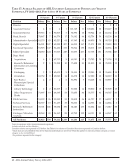
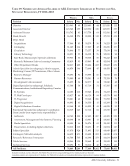
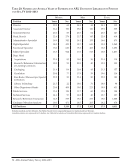
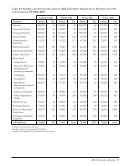
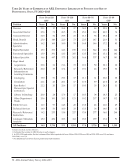
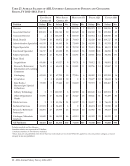
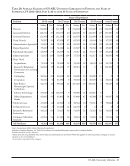
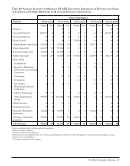
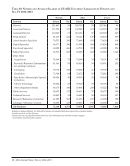
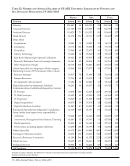
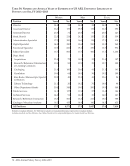
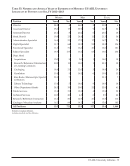
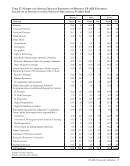
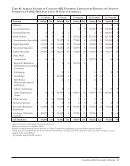
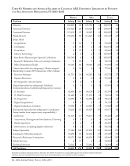
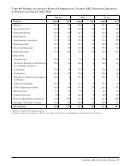
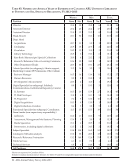
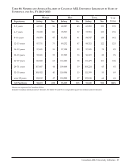
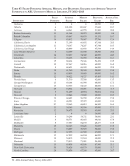
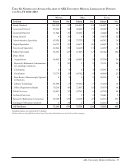
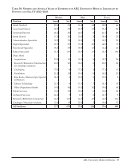
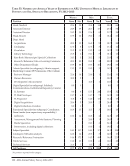
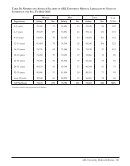
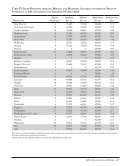
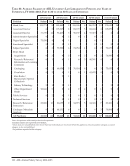
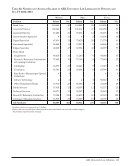
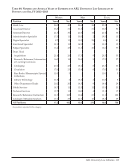
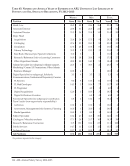
Salary Survey Trends 2012–2013 · 19 Most commonly, directors may have no rank (or a rank outside the structure), and it is common for non- librarians included in the survey (business officers, personnel staff, computer specialists, liaisons, etc.) to be unranked, as well. The pattern of relationships between rank and salary seen in past years continues: with higher rank associated with higher average years of experience and a correspondingly higher salary. In ARL university member libraries 6,198 of the 10,0726 librarians occupy a rank within these three most commonly found ranking systems, and the largest number of professionals (3,263) occupy a position in a four-step rank structure. Figure 6a: Average Salaries and Average Years of Experience of Library Professionals in Libraries with Three, Four, and Five Step Rank Structures, FY 2012–2013 Three-Step Four-Step Five-Step Salary Experience No. of Staff Salary Experience No. of Staff Salary Experience No. of Staff Librarian 1 62,336 8.5 470 56,436 8.3 449 55,326 11.3 227 Librarian 2 74,319 18.6 659 63,063 12.1 915 62,142 13.9 312 Librarian 3 91,699 25.2 417 76,817 20.2 1,268 74,483 18.0 468 Librarian 4 ..92,830 26.8 631 88,708 22.8 271 Librarian 5 ....107,342 29.0 111 No. of Staff 1,546 3,263 1,389 The direct relationship between rank and salary is highlighted even more in the three new tables below, which show average salary by percentile in each of the three rank structures presented in Figure 6. Figure 6b: Average Salary by Percentile in Libraries with Three Step Rank Structures, FY 2012–2013 No. of Staff Low 25th Percentile Median 75th Percentile High Librarian 1 470 25,164 50,500 57,847 71,081 149,927 Librarian 2 659 41,248 58,224 68,046 83,549 159,256 Librarian 3 417 46,402 75,708 87,887 103,162 184,875 Figure 6c: Average Salary by Percentile in Libraries with Four Step Rank Structures, FY 2012–2013 No. of Staff Low 25th Percentile Median 75th Percentile High Librarian 1 449 30,456 48,200 53,663 62,676 134,026 Librarian 2 915 29,189 52,277 60,050 70,956 165,098 Librarian 3 1268 38,430 61,606 72,031 87,452 193,640 Librarian 4 631 37,914 73,905 86,208 105,625 243,800 6 In previous years, this figure excluded law and health sciences librarians. Beginning with the 2012–2013 ARL salary survey, this figure now includes law and health sciences librarians, in keeping with the data shown in Figure 6.
Help