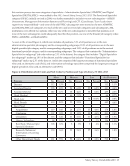
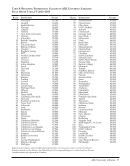
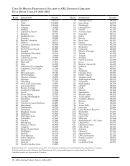
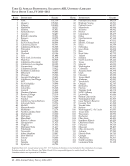
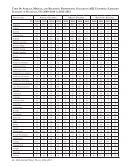
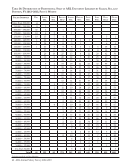
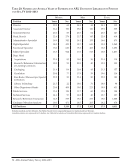
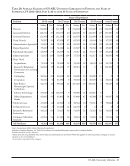
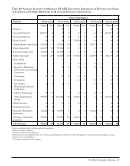
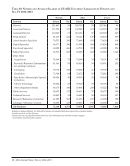
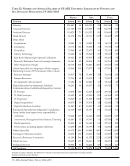
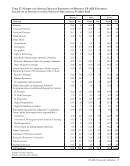
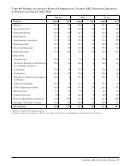
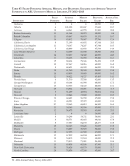
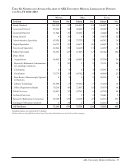
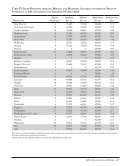
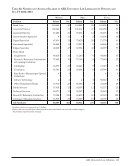
ARL University Law Libraries · 105 Institution Filled Positions Average Salary Median Salary Beginning Salary Average Yrs. Exp. New Mexico 6 70,695 71,760 50,000 11.2 New York University 19 82,599 75,090 70,000 23.7 North Carolina 12 74,168 68,816 57,000 14.8 Northwestern 8 71,436 69,520 50,000 23.5 Notre Dame 14 72,475 69,350 47,000 18.4 Ohio State 8 61,587 58,500 48,000 8.8 Oklahoma 7 59,551 52,852 42,000 17.9 Oregon 8 55,332 54,000 42,000 15.5 Ottawa 4 ‡ ‡ 49,996 19.5 Pennsylvania 15 70,432 68,653 45,000 16.1 Pennsylvania State 9 78,568 72,402 57,000 22.8 Queen`s 3 ‡ ‡ 53,718 12.7 Rutgers, Camden 5 88,813 88,989 70,000 21.4 Rutgers, Newark 9 85,608 76,331 62,000 18.4 Saskatchewan 2 ‡ ‡ 60,314 15.0 South Carolina 9 66,473 69,000 55,000 14.3 Southern Illinois 4 ‡ ‡ 50,000 9.0 SUNY Buffalo 12 69,728 67,036 60,000 15.8 Syracuse 10 60,044 56,631 46,700 16.4 Temple 10 66,364 55,200 44,044 26.1 Tennessee 9 68,941 61,867 55,000 13.4 Texas 17 69,671 57,679 58,000 14.3 Texas Tech 8 63,370 59,239 50,500 11.0 Toronto 6 97,224 103,067 56,591 14.8 Tulane 8 63,064 62,465 45,000 13.9 Utah 7 66,815 66,660 52,500 16.1 Vanderbilt 6 72,321 66,361 42,500 18.7 Virginia 14 72,538 66,700 63,500 16.7 Washington 17 69,932 65,004 61,000 21.7 Washington U.-St. Louis 9 68,377 65,663 50,000 22.8 Wayne State 5 62,363 57,360 50,000 20.8 Western 3 ‡ ‡ 54,608 17.3 Wisconsin 11 64,337 61,514 41,336 21.9 Yale 19 83,814 75,000 51,500 15.8 York 5 98,393 101,012 48,819 18.2 Directors are included in figures for filled positions and average years of experience, but not in either the average or median salary statistics. Canadian salaries are expressed in US dollars. ‡ Salary data are not published when fewer than four individuals are involved. Table 57: Filled Positions Average, Median, and Beginning Salaries and Average Years of Experience in ARL University Law Libraries, FY 2012–2013
Help