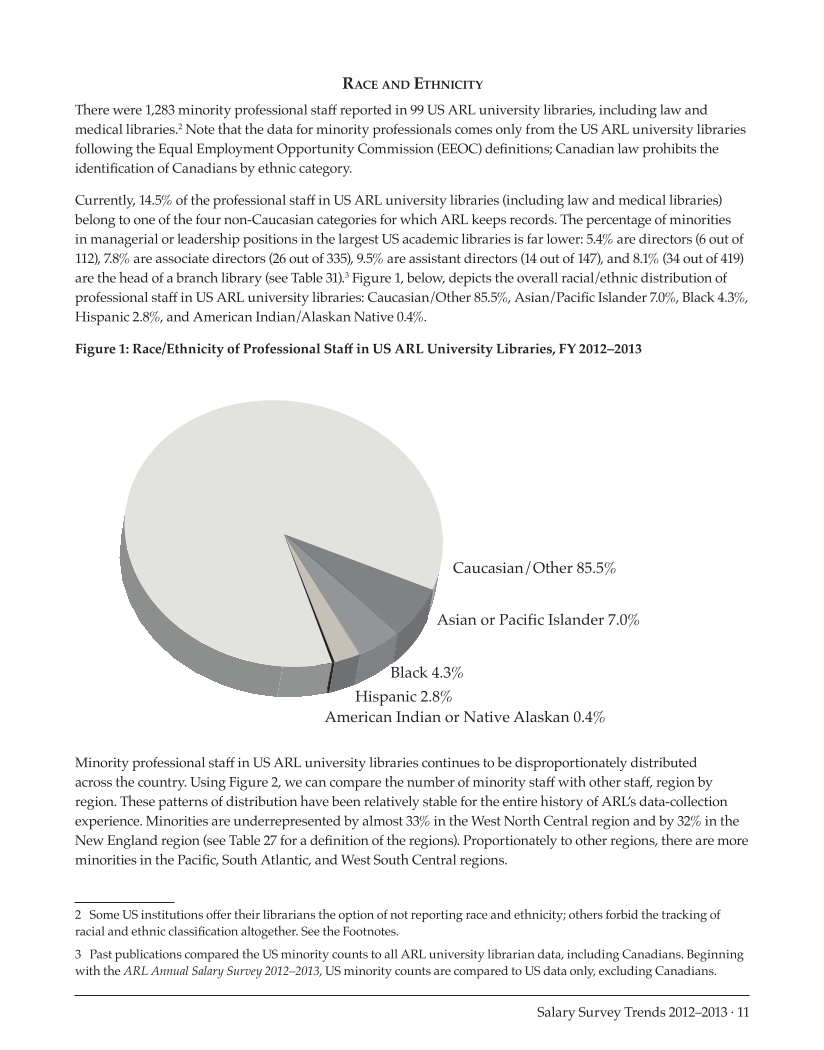
Salary Survey Trends 2012–2013 · 11 Race and Ethnicity There were 1,283 minority professional staff reported in 99 US ARL university libraries, including law and medical libraries.2 Note that the data for minority professionals comes only from the US ARL university libraries following the Equal Employment Opportunity Commission (EEOC) definitions Canadian law prohibits the identification of Canadians by ethnic category. Currently, 14.5% of the professional staff in US ARL university libraries (including law and medical libraries) belong to one of the four non-Caucasian categories for which ARL keeps records. The percentage of minorities in managerial or leadership positions in the largest US academic libraries is far lower: 5.4% are directors (6 out of 112), 7.8% are associate directors (26 out of 335), 9.5% are assistant directors (14 out of 147), and 8.1% (34 out of 419) are the head of a branch library (see Table 31).3 Figure 1, below, depicts the overall racial/ethnic distribution of professional staff in US ARL university libraries: Caucasian/Other 85.5%, Asian/Pacific Islander 7.0%, Black 4.3%, Hispanic 2.8%, and American Indian/Alaskan Native 0.4%. Figure 1: Race/Ethnicity of Professional Staff in US ARL University Libraries, FY 2012–2013 Caucasian/Other 85.5% American Indian or Native Alaskan 0.4% Asian or Pacific Islander 7.0% Hispanic 2.8% Black 4.3% Minority professional staff in US ARL university libraries continues to be disproportionately distributed across the country. Using Figure 2, we can compare the number of minority staff with other staff, region by region. These patterns of distribution have been relatively stable for the entire history of ARL’s data-collection experience. Minorities are underrepresented by almost 33% in the West North Central region and by 32% in the New England region (see Table 27 for a definition of the regions). Proportionately to other regions, there are more minorities in the Pacific, South Atlantic, and West South Central regions. 2 Some US institutions offer their librarians the option of not reporting race and ethnicity others forbid the tracking of racial and ethnic classification altogether. See the Footnotes. 3 Past publications compared the US minority counts to all ARL university librarian data, including Canadians. Beginning with the ARL Annual Salary Survey 2012–2013, US minority counts are compared to US data only, excluding Canadians.
Help


