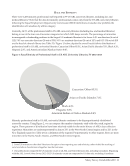
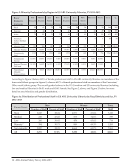
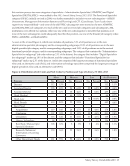
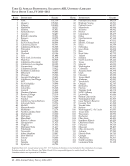
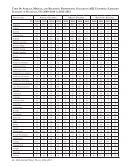
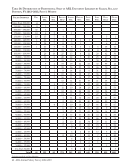
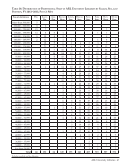
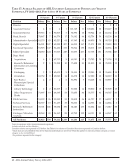
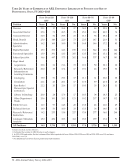
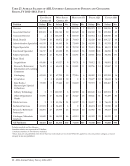
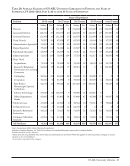
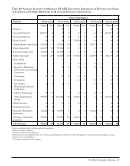
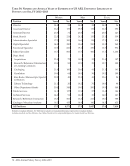
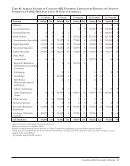
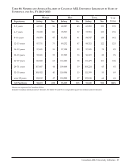
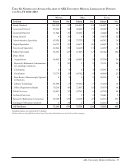
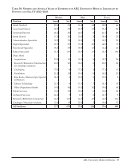
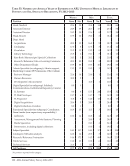
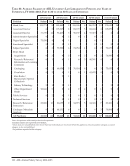
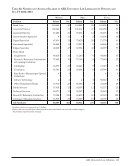
12 · ARL Annual Salary Survey 2012–2013 Figure 2: Minority Professionals by Region in US ARL University Libraries, FY 2012–2013 Race/ Ethnicity Category New England Middle Atlantic East North Central West North Central South Atlantic East South Central West South Central Mountain Pacific Total %Black 25 61 72 20 114 24 28 7 33 384 30% Hispanic 21 44 25 8 40 6 36 20 49 249 19% Asian 79 101 79 23 86 11 45 19 174 617 48% American Indian/Alaskan Native 6 3 4 4 2 1 3 9 1 33 3% Minority Total 131 209 180 55 242 42 112 55 257 1,283 100.0% Minority Percent 10.20% 16.30% 14.00% 4.30% 18.90% 3.30% 8.70% 4.30% 20.00% Nonminority Total 1,132 1,239 1,294 484 1,273 357 605 421 756 7,561 100.0% Nonminority Percent 15.00% 16.40% 17.10% 6.40% 16.80% 4.70% 8.00% 5.60% 10.00% Regional Percent Total staff 14.30% 16.40% 16.70% 6.10% 17.10% 4.50% 8.10% 5.40% 11.50% Proportional Minority Representation -32.00% -0.61% -18.13% -32.81% 12.50% -29.79% 8.75% -23.21% 100.00% According to Figure 3 below, 69.3% of female professional staff in US ARL university libraries are members of the four racial/ethnic groups in Figure 2, whereas 61.7% of female professional staff are members of the Caucasian/ Other racial/ethnic group. The overall gender balance in the 115 Canadian and US university libraries (including law and medical libraries) is 36.4% male and 63.6% female. See Figure 2, above, and Figure 3, below, for more detail on race/ethnicity and gender distribution. Figure 3a: Distribution of Professional Staff in US ARL University Libraries by Race/Ethnicity and Sex, FY 2012–2013 United States Men Women Total Number of Staff Percent of Staff Number of Staff Percent of Staff Staff Main 2,847 38.4% 4,571 61.6% 7,418 Medical 216 27.4% 573 72.6% 789 Law 260 36.4% 454 63.6% 714 Minority* 394 30.7% 889 69.3% 1,283 Non-minority 2,897 38.3% 4,664 61.7% 7,561 All 3,291 37.2% 5,553 62.8% 8,844
Help