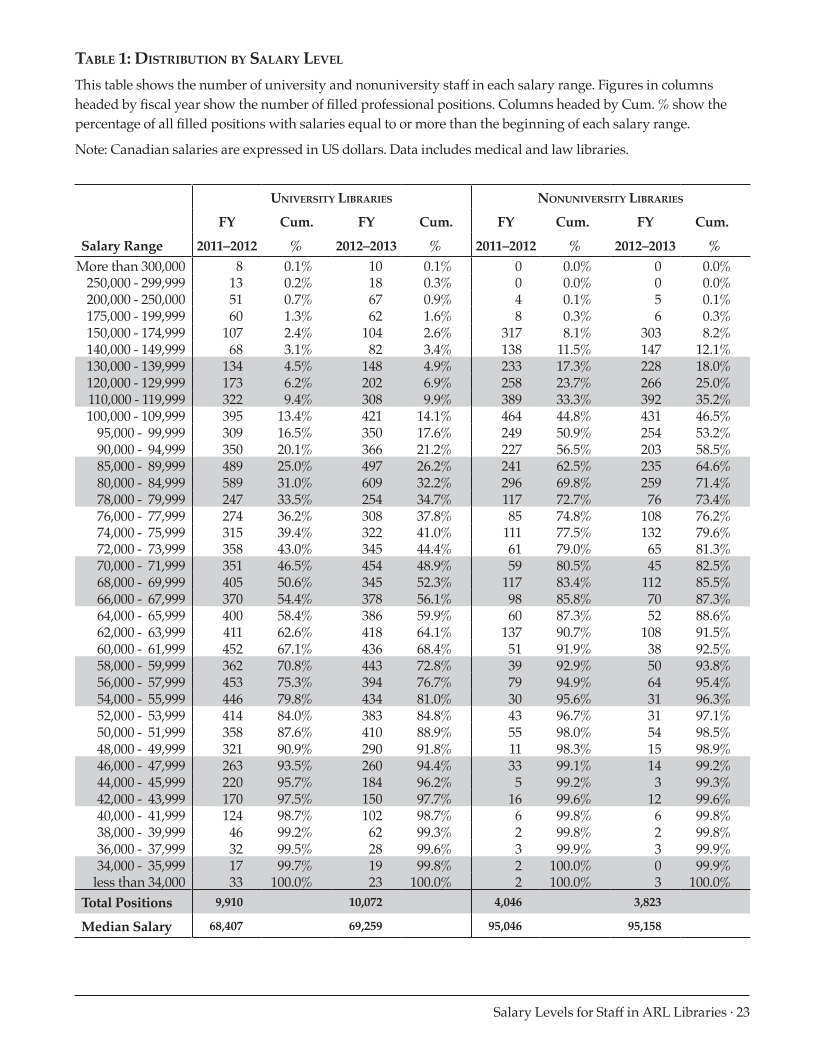
Salary Levels for Staff in ARL Libraries · 23 Table 1: Distribution by Salary Level This table shows the number of university and nonuniversity staff in each salary range. Figures in columns headed by fiscal year show the number of filled professional positions. Columns headed by Cum. %show the percentage of all filled positions with salaries equal to or more than the beginning of each salary range. Note: Canadian salaries are expressed in US dollars. Data includes medical and law libraries. University Libraries Nonuniversity Libraries FY Cum. FY Cum. FY Cum. FY Cum. Salary Range 2011–2012 %2012–2013 %2011–2012 %2012–2013 %More than 300,000 8 0.1% 10 0.1% 0 0.0% 0 0.0% 250,000 -299,999 13 0.2% 18 0.3% 0 0.0% 0 0.0% 200,000 -250,000 51 0.7% 67 0.9% 4 0.1% 5 0.1% 175,000 -199,999 60 1.3% 62 1.6% 8 0.3% 6 0.3% 150,000 -174,999 107 2.4% 104 2.6% 317 8.1% 303 8.2% 140,000 -149,999 68 3.1% 82 3.4% 138 11.5% 147 12.1% 130,000 -139,999 134 4.5% 148 4.9% 233 17.3% 228 18.0% 120,000 -129,999 173 6.2% 202 6.9% 258 23.7% 266 25.0% 110,000 -119,999 322 9.4% 308 9.9% 389 33.3% 392 35.2% 100,000 -109,999 395 13.4% 421 14.1% 464 44.8% 431 46.5% 95,000 -99,999 309 16.5% 350 17.6% 249 50.9% 254 53.2% 90,000 -94,999 350 20.1% 366 21.2% 227 56.5% 203 58.5% 85,000 -89,999 489 25.0% 497 26.2% 241 62.5% 235 64.6% 80,000 -84,999 589 31.0% 609 32.2% 296 69.8% 259 71.4% 78,000 -79,999 247 33.5% 254 34.7% 117 72.7% 76 73.4% 76,000 -77,999 274 36.2% 308 37.8% 85 74.8% 108 76.2% 74,000 -75,999 315 39.4% 322 41.0% 111 77.5% 132 79.6% 72,000 -73,999 358 43.0% 345 44.4% 61 79.0% 65 81.3% 70,000 -71,999 351 46.5% 454 48.9% 59 80.5% 45 82.5% 68,000 -69,999 405 50.6% 345 52.3% 117 83.4% 112 85.5% 66,000 -67,999 370 54.4% 378 56.1% 98 85.8% 70 87.3% 64,000 -65,999 400 58.4% 386 59.9% 60 87.3% 52 88.6% 62,000 -63,999 411 62.6% 418 64.1% 137 90.7% 108 91.5% 60,000 -61,999 452 67.1% 436 68.4% 51 91.9% 38 92.5% 58,000 -59,999 362 70.8% 443 72.8% 39 92.9% 50 93.8% 56,000 -57,999 453 75.3% 394 76.7% 79 94.9% 64 95.4% 54,000 -55,999 446 79.8% 434 81.0% 30 95.6% 31 96.3% 52,000 -53,999 414 84.0% 383 84.8% 43 96.7% 31 97.1% 50,000 -51,999 358 87.6% 410 88.9% 55 98.0% 54 98.5% 48,000 -49,999 321 90.9% 290 91.8% 11 98.3% 15 98.9% 46,000 -47,999 263 93.5% 260 94.4% 33 99.1% 14 99.2% 44,000 -45,999 220 95.7% 184 96.2% 5 99.2% 3 99.3% 42,000 -43,999 170 97.5% 150 97.7% 16 99.6% 12 99.6% 40,000 -41,999 124 98.7% 102 98.7% 6 99.8% 6 99.8% 38,000 -39,999 46 99.2% 62 99.3% 2 99.8% 2 99.8% 36,000 -37,999 32 99.5% 28 99.6% 3 99.9% 3 99.9% 34,000 -35,999 17 99.7% 19 99.8% 2 100.0% 0 99.9% less than 34,000 33 100.0% 23 100.0% 2 100.0% 3 100.0% Total Positions 9,910 10,072 4,046 3,823 Median Salary 68,407 69,259 95,046 95,158
Help


