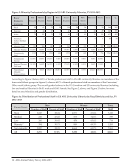
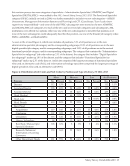
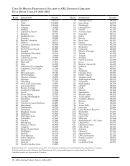
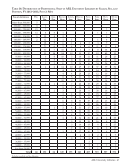
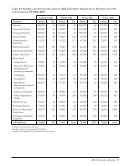
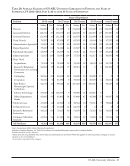
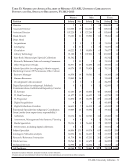
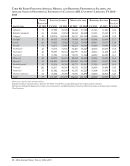
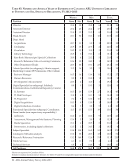
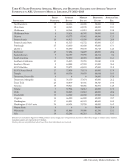
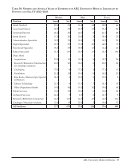
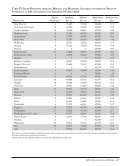
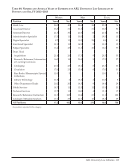
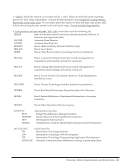
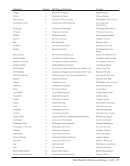
58 · ARL Annual Salary Survey 2012–2013 Table 26: Years of Experience of ARL University Librarians by Position and Size of Professional Staff, FY 2012–2013 Staff Over 110 (18)† Staff 75–110 (18) Staff 50–74 (44) Staff 13–49 (35)‡ Position Years No. Years No. Years No. Years No. Director 33.1 17 35.8 17 34.1 44 33.9 34 Associate Director 25.6 71 26.5 78 25.1 112 26.5 74 Assistant Director 24.5 54 25.5 22 21.3 56 25.4 15 Head, Branch 23.0 148 22.0 73 23.5 147 21.9 51 Administrative Specialist 16.2 168 18.0 78 16.0 146 17.2 83 Digital Specialist 13.5 376 12.6 198 13.1 342 13.6 144 Functional Specialist 13.9 391 13.3 205 13.5 314 15.1 142 Subject Specialist 16.6 447 17.5 262 16.6 537 16.7 191 Dept. Head Acquisitions 20.8 24 21.6 15 22.3 50 20.1 30 Research/Reference/ Information or Learning Commons 20.0 38 17.4 17 19.1 46 19.8 32 Cataloging 19.9 51 25.2 17 21.1 61 22.0 28 Circulation 21.1 26 20.1 17 17.6 49 21.4 24 Rare Books/ Manuscripts/Special Collections 22.2 20 25.6 17 19.5 35 24.3 31 Library Technology 20.8 24 17.6 17 18.3 34 18.3 23 Other Department Heads 20.6 181 20.3 121 19.2 217 19.7 112 Public Services 11.5 95 14.8 28 15.8 46 11.0 29 Technical Services 14.9 56 10.0 33 15.3 36 14.0 12 Research/Reference/ Instruction 14.2 255 13.8 227 15.9 277 16.0 249 Cataloger/Metadata Analysts 18.3 282 18.3 112 18.3 189 17.2 91 All Positions: 16.9 2,724 17.1 1,554 17.4 2,738 18.0 1,395 Excludes medical and law libraries. ()Indicates the number of ARL libraries in each category. † In 1995–1996 and earlier, the first column of this table reported staff over 124 in 1996–1998 over 120 in 1998–1999 over 115 and since 1999–2000, over 110. ‡ No ARL library has fewer than 15 professional staff members.
Help