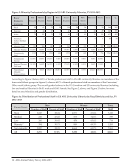
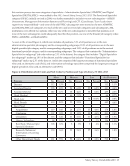
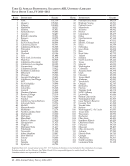
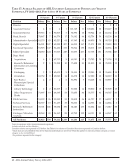
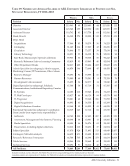
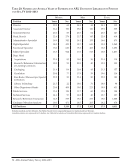
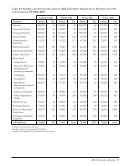
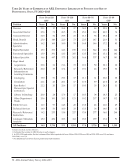
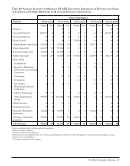
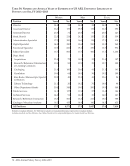
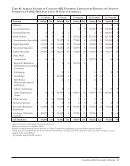
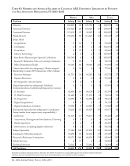
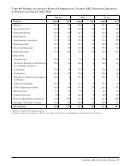
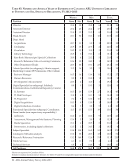
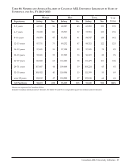
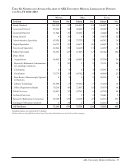
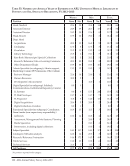
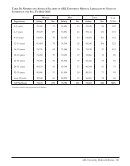
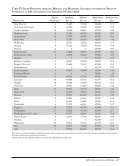
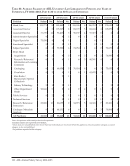
18 · ARL Annual Salary Survey 2012–2013 Position Women Men All Positions Average No. Average No. Average No. Assessment, Management Information Systems, Planning 69,387 39 65,740 14 68,424 53 Media Specialists 59,990 49 57,618 70 58,595 119 Preservation, including digital collections 63,616 110 67,904 38 64,717 148 Subject Specialist 67,098 1,088 71,156 560 68,477 1,648 Catalogers/Metadata analysts 64,486 514 65,795 216 64,873 730 Research/Reference/Instruction 66,856 1,030 66,362 387 66,721 1,417 Public Services 60,596 181 60,704 78 60,628 259 Technical Services 59,393 117 57,971 46 58,992 163 All Positions: 74,772 6,410 77,977 3,662 75,937 10,072 In regards to the gender gap in ARL libraries discussed in the previous section, it is worth noting that the average salaries of men are higher than those of women in 22 out of the 33 categories in Figure 5. Institutional Characteristics and Salaries Public and Private Institutions The gap between salaries paid in private ARL university libraries and those paid in publicly supported ARL university libraries increased in 2012–2013 to 9.6%, with librarians at private institutions earning an average of $6,821 more than their peers at public institutions. Librarians in public institutions systematically earned less than their peers employed in private institutions across all 19 job categories in Table 23. Library Size Library size, as measured by the number of professional staff, is another significant determinant of salary. As a rule, the largest libraries tend to pay the highest average salaries, not only overall, but for specific positions, as well. However, in 2012–2013 libraries with 75 to 100 staff reported the highest average salary, $79,748, followed by the largest libraries, i.e., those with more than 110 staff, which reported the next highest average salary $76,744 (see Table 25). The gap between the highest paying cohort and the lowest paying cohort more than doubled in 2012–2013, increasing to $7,561. The cutoff staffing levels used to determine the largest cohort of libraries, after declining in every year since 1995–96, continued to hold steady at 110 in 2012–2013.5 Geographic Area In 2012–2013, the highest average salaries were found in Canada ($91,008), followed by New England ($81,204), with salaries in the Middle Atlantic region ($78,639) coming in third (see Table 25). The Canadian average salary peaked this year, reflecting an all-time high. (For the 2012–2013 survey period, the Canadian currency exchange rate was 1.0037.) The West South Central region had the lowest average salary: $63,313. Rank Structure Rank structure provides a useful framework for examining professional salaries in ARL university libraries. Figure 6, below, displays average salary and years of experience in the most commonly used rank structures. Readers should be aware that not all individuals have a rank that fits into the rank structure the library utilizes. 5 In 1995–96, the largest cohort of libraries was determined based on staff over 124 in 1996–98, over 120 in 1998–99, over 115 and since 1999–2000, over 110. See Table 23.
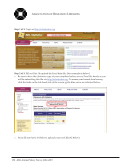
Help