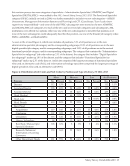
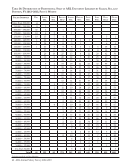
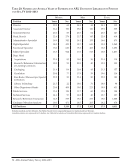
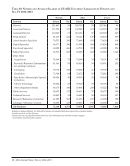
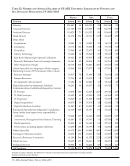
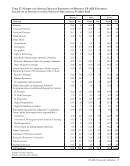
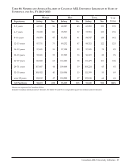
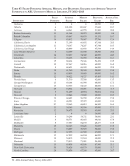
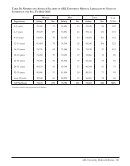
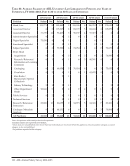
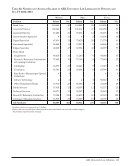
US ARL University Libraries · 77 Table 39: Number and Average Salaries of Minority US ARL University Librarians by Years of Experience and Sex, FY 2011–2012 Women Men Total %of Total Experience Salary No. Salary No. Salary No. 0–3 years 52,818 78 56,028 24 53,573 102 10% 4–7 years 56,842 123 60,517 62 58,074 185 18% 8–11 years 60,128 121 69,465 48 62,780 169 16% 12–15 years 69,361 87 72,928 63 70,859 150 14% 16–19 years 76,377 82 76,088 34 76,292 116 11% 20–23 years 75,894 64 89,066 29 80,002 93 9% 24–27 years 80,158 65 84,570 23 81,311 88 8% 28–31 years 71,530 30 80,819 14 74,485 44 4% 32–35 years 80,781 25 87,634 18 83,650 43 4% over 35 years 91,942 46 124,956 12 98,772 58 6% All Positions: 68,164 721 74,461 327 70,129 1,048 100% Excludes Canadian libraries. Excludes medical and law libraries.
Help