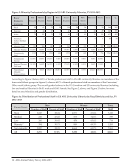
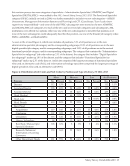
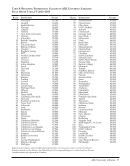
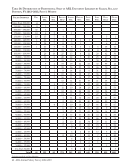
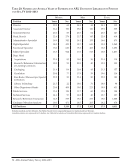
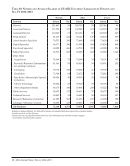
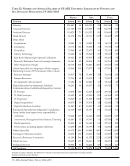
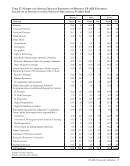
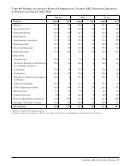
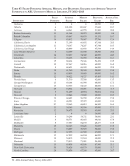
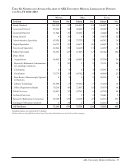
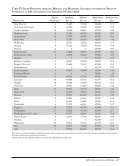
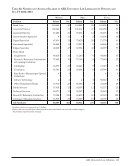
ARL University Medical Libraries · 91 Institution Filled Positions Average Salary Median Salary Beginning Salary Average Yrs. Exp. Northwestern 15 68,436 68,098 50,000 19.3 Ohio State 10 68,343 65,235 48,000 19.1 Oklahoma 9 60,364 61,219 40,000 19.8 Oklahoma State 4 52,414 46,392 38,000 18.5 Ottawa 6 83,375 83,062 49,996 12.3 Pennsylvania 10 66,913 63,030 45,000 20.0 Pennsylvania State 6 61,313 61,752 45,000 13.7 Pittsburgh 27 63,630 60,600 45,000 17.1 Queen`s 7 86,690 89,158 53,718 14.3 Rochester 25 57,284 54,489 40,000 20.4 Saskatchewan 7 80,157 77,755 60,314 9.4 South Carolina 9 52,020 48,093 38,000 16.1 Southern California 15 76,235 70,955 53,045 19.0 Southern Illinois 5 64,088 67,353 41,000 26.4 SUNY Buffalo 10 70,072 65,833 47,000 21.5 SUNY Stony Brook 17 72,838 75,174 45,000 17.9 Temple 10 60,536 59,678 44,044 18.5 Tennessee, Knoxville 4 ‡ ‡ 39,000 15.0 Tennessee, Memphis 12 56,150 57,474 45,000 21.2 Texas Tech 23 50,879 47,551 38,347 19.6 Toronto 18 99,941 98,056 56,591 14.5 Tulane 7 57,964 54,612 42,000 17.6 Utah 16 68,023 61,610 40,000 20.4 Vanderbilt 12 64,209 68,290 42,500 16.4 Virginia 14 66,500 66,800 45,000 23.7 Washington 17 65,021 60,570 42,600 18.9 Washington U.-St. Louis 24 60,434 53,709 40,000 16.2 Wayne State 4 ‡ ‡ 50,000 21.8 Wisconsin 14 61,846 59,006 41,336 15.1 Yale 19 82,246 80,210 51,500 19.1 Directors are included in figures for filled positions and average years of experience, but not in either the average or median salary statistics. Canadian salaries are expressed in US dollars. ‡ Salary data are not published when fewer than four individuals are involved. Table 47: Filled Positions Average, Median, and Beginning Salaries and Average Years of Experience in ARL University Medical Libraries, FY 2012–2013
Help