SPEC Kit 341: Digital Collections Assessment and Outreach · 17
Tracking and Reporting
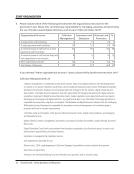
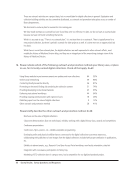
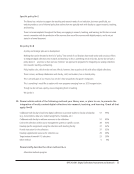
Twenty-five libraries (37%) reported that they track the
impact of their promotion and outreach activities, and
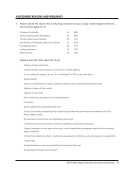
another 21 (31%) plan to. URL hit counts are the most
frequently reported tracking method (40 responses,
or 87%). Head counts at promotional events, counts
of reference questions, and hit counts on specific date
ranges are the next most frequently used methods.
Other methods include tracking social media follow-
ers, likes, shares, and re-tweets, reviewing blog analyt-
ics, conducting user surveys, and direct user feedback.
One respondent commented that the ad hoc nature
of promotional activities made tracking their impact
difficult. Another said they track outreach and promo-
tion activities but don’t distinguish digital from other
collection content.
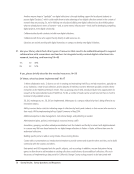
Only 15 libraries (23%) track the integration of lo-
cally curated digital collections into research, teach-
ing, and learning, though another 19 (29%) plan to.
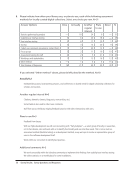
The most common method is tracking citations and
references to collections in scholarly publications (23
of 30 responses, or 77%). Fourteen respondents (47%)
track citations and references in instructional materi-
als. Through citation tracking and author notifica-
tion, libraries have found that their digital content
has been used in publications such as journal articles,
books and book chapters, and in scholar curated on-
line exhibits. Other types of resources that use digital
items include films and videos, dissertations, gray
literature, scholarly blogs, lesson plans, symposia,
performances, and encyclopedias.
Other methods used to measure the impact of in-
tegrating digital collections include Google Alerts
when material is used, tracking references to collec-
tions in social media, surveys and interviews of users,
and counting the number of events and classrooms
visited. Whichever tracking method is chosen, one
respondent commented that it “must be easy to de-
velop, to use, and to maintain.”
The responding libraries have used the collected
data to develop new initiatives, support planning for
collaboration and other activities, add new content
related to collections, and sustain collections by mak-
ing them more visible. They have included statistics
in grant and annual reports. They have improved in-
frastructure, and gained financial and other resource
support for digital systems. Overall, gathering collec-
tion statistics gives administrators a chance to share
information on their return on investment and the
value of developing locally curated collections to-
wards meeting the strategic mission of the institu-
tion. Faculty benefit, too, since data pertaining to their
own work can be used in their tenure and promotion
materials some collections may enable users to look
up impact of work in terms of times cited or viewed.
Major Trends and Emerging Practices
The survey asked for brief additional comments on
if and how new initiatives and services—like those
in the Digital Humanities, digital scholarship, digital
publishing, and data curation—relate to respondents’
locally curated digital collections in terms of outreach,
assessment, and integration with research and teach-
ing. Respondents described a wealth of activities and
work underway that support collection outreach and
integration with research and teaching. However, de-
scriptions of activities to assess and evaluate these
new initiatives and services were notably lacking.
One respondent commented on the importance of
approaches that bring together assessment, outreach,
and integration:
“Basically, it feels like everything is changing in re-
search libraries in general, and in our own library
specifically, and the more quantifiable assess-
ment, active outreach, and close integration with
research and teaching that we can do, the more
secure, sustainable, and vital the library will be in
the university landscape in the decades to come.”
Another respondent similarly noted:
“We have an opportunity, with digital, to better
understand how collections are used through the
analysis of all types of usage data and subsequent,
informed, consultation of users. We have hardly
tapped this potential. At the same time, we receive
a constant, heavy stream of direct feedback when
problems occur or a need is not met. We are more
reactive than proactive in this regard.”
Respondents recognize the need to build and
sustain socio-technical infrastructures to support
assessment and the next steps based on assessment.
Tracking and Reporting
Twenty-five libraries (37%) reported that they track the
impact of their promotion and outreach activities, and
another 21 (31%) plan to. URL hit counts are the most
frequently reported tracking method (40 responses,
or 87%). Head counts at promotional events, counts
of reference questions, and hit counts on specific date
ranges are the next most frequently used methods.
Other methods include tracking social media follow-
ers, likes, shares, and re-tweets, reviewing blog analyt-
ics, conducting user surveys, and direct user feedback.
One respondent commented that the ad hoc nature
of promotional activities made tracking their impact
difficult. Another said they track outreach and promo-
tion activities but don’t distinguish digital from other
collection content.
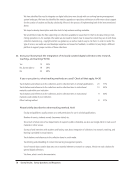
Only 15 libraries (23%) track the integration of lo-
cally curated digital collections into research, teach-
ing, and learning, though another 19 (29%) plan to.
The most common method is tracking citations and
references to collections in scholarly publications (23
of 30 responses, or 77%). Fourteen respondents (47%)
track citations and references in instructional materi-
als. Through citation tracking and author notifica-
tion, libraries have found that their digital content
has been used in publications such as journal articles,
books and book chapters, and in scholar curated on-
line exhibits. Other types of resources that use digital
items include films and videos, dissertations, gray
literature, scholarly blogs, lesson plans, symposia,
performances, and encyclopedias.
Other methods used to measure the impact of in-
tegrating digital collections include Google Alerts
when material is used, tracking references to collec-
tions in social media, surveys and interviews of users,
and counting the number of events and classrooms
visited. Whichever tracking method is chosen, one
respondent commented that it “must be easy to de-
velop, to use, and to maintain.”
The responding libraries have used the collected
data to develop new initiatives, support planning for
collaboration and other activities, add new content
related to collections, and sustain collections by mak-
ing them more visible. They have included statistics
in grant and annual reports. They have improved in-
frastructure, and gained financial and other resource
support for digital systems. Overall, gathering collec-
tion statistics gives administrators a chance to share
information on their return on investment and the
value of developing locally curated collections to-
wards meeting the strategic mission of the institu-
tion. Faculty benefit, too, since data pertaining to their
own work can be used in their tenure and promotion
materials some collections may enable users to look
up impact of work in terms of times cited or viewed.
Major Trends and Emerging Practices
The survey asked for brief additional comments on
if and how new initiatives and services—like those
in the Digital Humanities, digital scholarship, digital
publishing, and data curation—relate to respondents’
locally curated digital collections in terms of outreach,
assessment, and integration with research and teach-
ing. Respondents described a wealth of activities and
work underway that support collection outreach and
integration with research and teaching. However, de-
scriptions of activities to assess and evaluate these
new initiatives and services were notably lacking.
One respondent commented on the importance of
approaches that bring together assessment, outreach,
and integration:
“Basically, it feels like everything is changing in re-
search libraries in general, and in our own library
specifically, and the more quantifiable assess-
ment, active outreach, and close integration with
research and teaching that we can do, the more
secure, sustainable, and vital the library will be in
the university landscape in the decades to come.”
Another respondent similarly noted:
“We have an opportunity, with digital, to better
understand how collections are used through the
analysis of all types of usage data and subsequent,
informed, consultation of users. We have hardly
tapped this potential. At the same time, we receive
a constant, heavy stream of direct feedback when
problems occur or a need is not met. We are more
reactive than proactive in this regard.”
Respondents recognize the need to build and
sustain socio-technical infrastructures to support
assessment and the next steps based on assessment.