SPEC Kit 341: Digital Collections Assessment and Outreach · 113
DUKE UNIVERSITY
ROAD 2.0: Digitizing Outdoor Advertising. Final Report
http://blogs.library.duke.edu/digital-collections/files/2011/04/NARA-FinalReport1.pdf
NAR09-RD-10017-09 Digitizing Outdoor Advertising Final Report
4
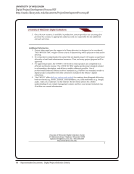
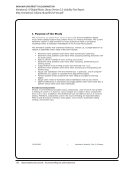
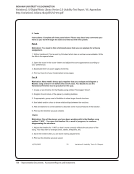
Survey. To further assess the use of the site, we also gathered web statistics through
Google Analytics.
The online survey was posted on the ROAD 2.0 website in September 2011. The
most recent analysis of survey results, collected in June 2012 and discussed in
greater detail below, supports earlier findings: users are satisfied with the site
content and usability and a greater number self-identify as “casual users” than we
would have expected. We were also surprised to learn that, of the respondents doing
topical research, the majority were apparently not researching the advertising
depicted in the photographs, and were instead using such criteria as geographical
place names to drive their search.
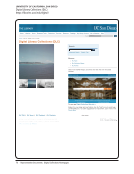
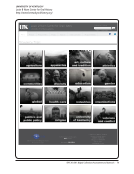
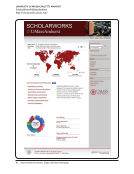
Analysis of web statistics revealed that ROAD 2.0 was among the more popular of our
digital collections, ranking 9th out of 40 based on portal pageviews. The length of
time visitors spent on the site, clicking through items and pages of search results,
supports the survey finding that users found the content relevant. Search terms used
also corroborated another survey finding: that users were frequently interested in the
places where the billboards were located, not just the advertisements themselves.
While some items in ROAD 2.0 were viewed over 100 times, pageview statistics
revealed that 38% of the collection had never been viewed, indicating that more
needs to be done to promote the ROAD 2.0 collection and to optimize the portal and
pages for search engine discovery.
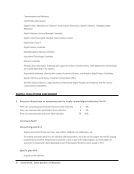
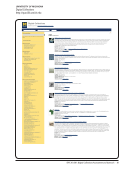
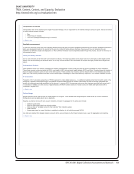
User Survey
In the fall of 2011, we developed and conducted a user study for assessing use and
value of ROAD 2.0. A brief web survey was positioned prominently on the site, for
visitors to voluntarily provide feedback. The initial results of that survey were shared
in the project’s Jul – Dec 2011 Interim Report. Since then, the survey has received
an additional eight responses, which are incorporated in the final analysis below.
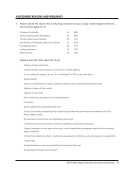
Between its launch on Sept 19, 2011 and June 20, 2012 (276 days), the survey
received 48 complete responses (averaging roughly one response every five days).
Yvonne Belanger (Duke University Libraries’ director of assessment) worked with Liz
Milewicz (PI), Lynn Eaton (Hartman Center), and Sean Aery (Digital Projects
Developer) to create questions that could accurately gauge the usability of the ROAD
2.0 interface and the value of the content for research, and also probe other ways
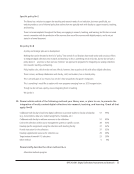
these materials are being used. Key goals for the online survey were to discover who
was using the site, how they were using it, and satisfaction with the site and content.
We also hoped to generate a high number of complete responses by keeping the
survey short, and not burdening the user with completing a long survey. Questions
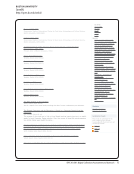
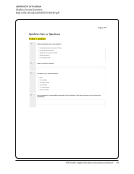
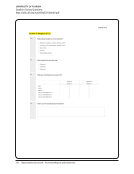
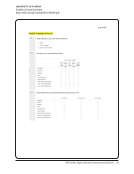
from this web survey are appended to this report (see APPENDIX 2: ROAD 2.0
Survey).
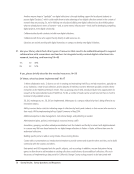
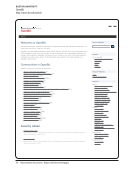
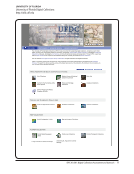
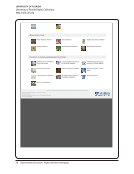
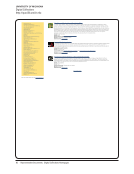
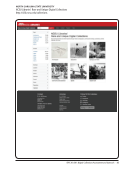
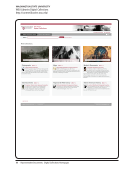
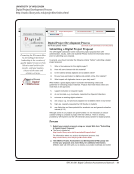
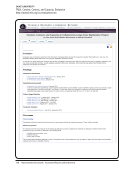
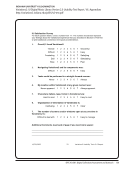
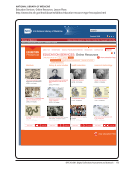
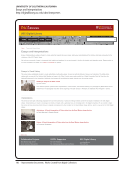
Survey questions were incorporated into a Qualtrics survey by Sean Aery. Aery also
embedded the survey into the online interface using prominent links in the main
ROAD 2.0 portal, the member collection portals, search results within either the main
portal or a member collection, and on item pages for any item from a ROAD 2.0
member collection.
DUKE UNIVERSITY
ROAD 2.0: Digitizing Outdoor Advertising. Final Report
http://blogs.library.duke.edu/digital-collections/files/2011/04/NARA-FinalReport1.pdf
NAR09-RD-10017-09 Digitizing Outdoor Advertising Final Report
4
Survey. To further assess the use of the site, we also gathered web statistics through
Google Analytics.
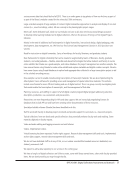
The online survey was posted on the ROAD 2.0 website in September 2011. The
most recent analysis of survey results, collected in June 2012 and discussed in
greater detail below, supports earlier findings: users are satisfied with the site
content and usability and a greater number self-identify as “casual users” than we
would have expected. We were also surprised to learn that, of the respondents doing
topical research, the majority were apparently not researching the advertising
depicted in the photographs, and were instead using such criteria as geographical
place names to drive their search.
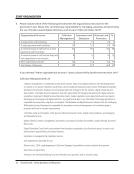
Analysis of web statistics revealed that ROAD 2.0 was among the more popular of our
digital collections, ranking 9th out of 40 based on portal pageviews. The length of
time visitors spent on the site, clicking through items and pages of search results,
supports the survey finding that users found the content relevant. Search terms used
also corroborated another survey finding: that users were frequently interested in the
places where the billboards were located, not just the advertisements themselves.
While some items in ROAD 2.0 were viewed over 100 times, pageview statistics
revealed that 38% of the collection had never been viewed, indicating that more
needs to be done to promote the ROAD 2.0 collection and to optimize the portal and
pages for search engine discovery.
User Survey
In the fall of 2011, we developed and conducted a user study for assessing use and
value of ROAD 2.0. A brief web survey was positioned prominently on the site, for
visitors to voluntarily provide feedback. The initial results of that survey were shared
in the project’s Jul – Dec 2011 Interim Report. Since then, the survey has received
an additional eight responses, which are incorporated in the final analysis below.
Between its launch on Sept 19, 2011 and June 20, 2012 (276 days), the survey
received 48 complete responses (averaging roughly one response every five days).
Yvonne Belanger (Duke University Libraries’ director of assessment) worked with Liz
Milewicz (PI), Lynn Eaton (Hartman Center), and Sean Aery (Digital Projects
Developer) to create questions that could accurately gauge the usability of the ROAD
2.0 interface and the value of the content for research, and also probe other ways
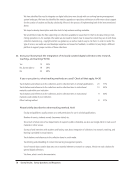
these materials are being used. Key goals for the online survey were to discover who
was using the site, how they were using it, and satisfaction with the site and content.
We also hoped to generate a high number of complete responses by keeping the
survey short, and not burdening the user with completing a long survey. Questions
from this web survey are appended to this report (see APPENDIX 2: ROAD 2.0
Survey).
Survey questions were incorporated into a Qualtrics survey by Sean Aery. Aery also
embedded the survey into the online interface using prominent links in the main
ROAD 2.0 portal, the member collection portals, search results within either the main
portal or a member collection, and on item pages for any item from a ROAD 2.0
member collection.