114 · Representative Documents: Assessment Reports and Instruments
DUKE UNIVERSITY
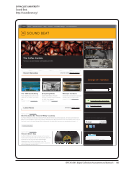
ROAD 2.0: Digitizing Outdoor Advertising. Final Report
http://blogs.library.duke.edu/digital-collections/files/2011/04/NARA-FinalReport1.pdf
NAR09-RD-10017-09 Digitizing Outdoor Advertising Final Report
5
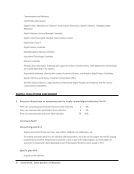
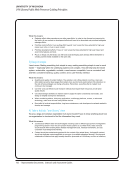
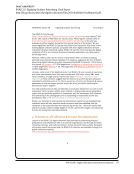
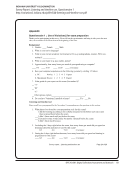
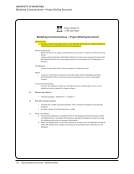
Analysis of User Survey Responses
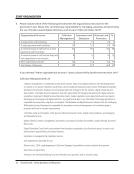
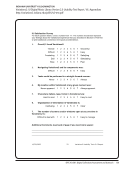
There were 66 total responses to the survey. Forty-eight responses (73%) were
complete and so were used to develop analysis. The remaining 18 responses (27%)
were partial responses (started but abandoned before the end of the survey) and
thus were excluded from analysis. Of the total 48 analyzed responses, 26 (54%)
included additional feedback. A detailed analysis of responses to survey questions is
appended to this report, along with complete listings of the additional feedback users
provided (see APPENDICES 3-5).
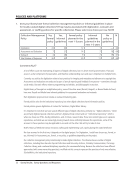
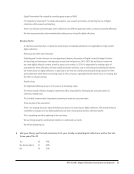
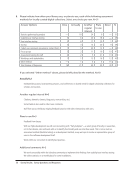
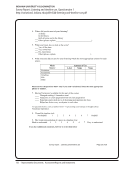
Overall, responses to the survey were very positive, with most users reporting high
degrees of satisfaction (see APPENDIX 4: Detailed Analysis of Responses to ROAD
2.0 Survey). Of the users seeking particular images, 86% were satisfied (either
“very” or “somewhat”). Likewise, 83% of users doing topical research reported
satisfaction. While the site’s ease of use was generally rated favorably, it is worth
noting that slightly more respondents felt it was “somewhat easy to use” (20, or 42%)
than “very easy to use” (19, or 40%).
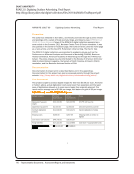
The types of users and uses identified were also insightful, as they indicated to us a
higher percentage of casual users than we might have expected (see APPENDIX 4:
Detailed Analysis of Responses to ROAD 2.0 Survey). It was also surprising to learn
that of the respondents doing topical research, the majority was apparently not
researching the signs, billboards, or advertising depicted in the photographs. Though
there are too few responses to generalize, it is worth noting that geographical place
names figured prominently among the research topics. (See APPENDIX 3: ROAD 2.0
Users’ Research Topics for all user-supplied responses to this question.)
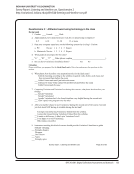
Slow load times, difficulties navigating between several images at once, and
insufficient description of outdoor advertisements’ locations were all cited as
negative aspects of the site (see APPENDIX 5: ROAD 2.0 Users’ Additional
Feedback). It is likely that the site’s unresponsiveness was a primary factor for the
users who expressed difficulty or dissatisfaction using the site, given the prevalence
of comments that cited slowness as a problem. Slow load times have been
problematic for all of Duke’s collections during this assessment period, but
development is underway to speed up the application by the end of summer 2012.
Some of the navigation features requested by users (grid view and category-specific
slideshow) were actually already possible in the application, so these may not be
presented clearly enough in the interface.
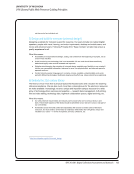
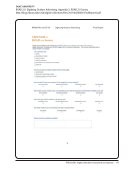
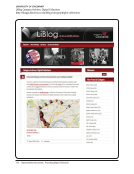
Web Analytics
We used Google Analytics on all pages of the ROAD 2.0 website in order to measure
user interactions with the site and the digitized items within. Statistics were collected
for the period April 18, 2011 to June 27, 2012, covering the entire lifetime of the
website to date. A project launch timeline (APPENDIX 6: Timeline of Web Statistics)
contextualizes the dates during which web statistics were gathered. A more complete
breakdown and discussion of these statistics, analyzed in summary form below, are
appended to this report (see APPENDICES 7-11).
DUKE UNIVERSITY
ROAD 2.0: Digitizing Outdoor Advertising. Final Report
http://blogs.library.duke.edu/digital-collections/files/2011/04/NARA-FinalReport1.pdf
NAR09-RD-10017-09 Digitizing Outdoor Advertising Final Report
5
Analysis of User Survey Responses
There were 66 total responses to the survey. Forty-eight responses (73%) were
complete and so were used to develop analysis. The remaining 18 responses (27%)
were partial responses (started but abandoned before the end of the survey) and
thus were excluded from analysis. Of the total 48 analyzed responses, 26 (54%)
included additional feedback. A detailed analysis of responses to survey questions is
appended to this report, along with complete listings of the additional feedback users
provided (see APPENDICES 3-5).
Overall, responses to the survey were very positive, with most users reporting high
degrees of satisfaction (see APPENDIX 4: Detailed Analysis of Responses to ROAD
2.0 Survey). Of the users seeking particular images, 86% were satisfied (either
“very” or “somewhat”). Likewise, 83% of users doing topical research reported
satisfaction. While the site’s ease of use was generally rated favorably, it is worth
noting that slightly more respondents felt it was “somewhat easy to use” (20, or 42%)
than “very easy to use” (19, or 40%).
The types of users and uses identified were also insightful, as they indicated to us a
higher percentage of casual users than we might have expected (see APPENDIX 4:
Detailed Analysis of Responses to ROAD 2.0 Survey). It was also surprising to learn
that of the respondents doing topical research, the majority was apparently not
researching the signs, billboards, or advertising depicted in the photographs. Though
there are too few responses to generalize, it is worth noting that geographical place
names figured prominently among the research topics. (See APPENDIX 3: ROAD 2.0
Users’ Research Topics for all user-supplied responses to this question.)
Slow load times, difficulties navigating between several images at once, and
insufficient description of outdoor advertisements’ locations were all cited as
negative aspects of the site (see APPENDIX 5: ROAD 2.0 Users’ Additional
Feedback). It is likely that the site’s unresponsiveness was a primary factor for the
users who expressed difficulty or dissatisfaction using the site, given the prevalence
of comments that cited slowness as a problem. Slow load times have been
problematic for all of Duke’s collections during this assessment period, but
development is underway to speed up the application by the end of summer 2012.
Some of the navigation features requested by users (grid view and category-specific
slideshow) were actually already possible in the application, so these may not be
presented clearly enough in the interface.
Web Analytics
We used Google Analytics on all pages of the ROAD 2.0 website in order to measure
user interactions with the site and the digitized items within. Statistics were collected
for the period April 18, 2011 to June 27, 2012, covering the entire lifetime of the
website to date. A project launch timeline (APPENDIX 6: Timeline of Web Statistics)
contextualizes the dates during which web statistics were gathered. A more complete
breakdown and discussion of these statistics, analyzed in summary form below, are
appended to this report (see APPENDICES 7-11).