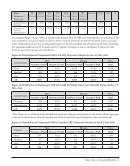
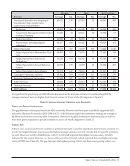
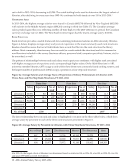
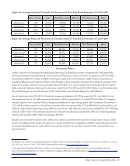
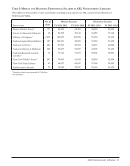
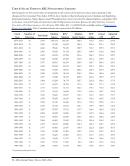
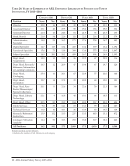
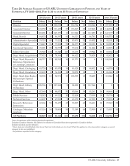
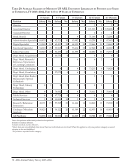
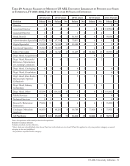
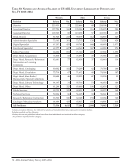
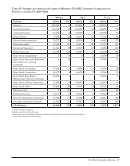
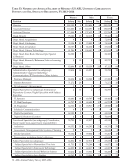
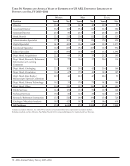
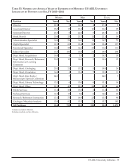
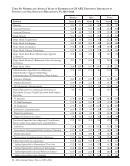
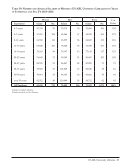
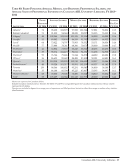
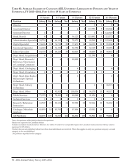
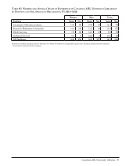
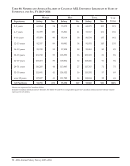
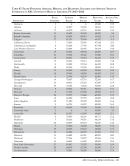
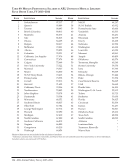
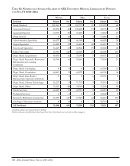
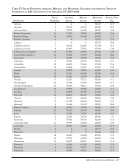
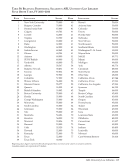
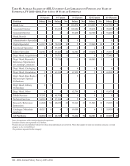
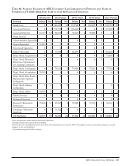
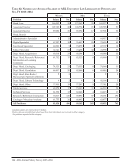
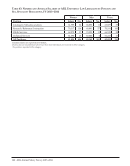
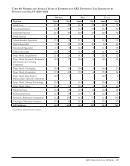
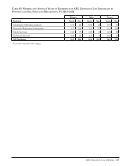
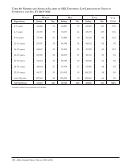
18 · ARL Annual Salary Survey 2013–2014 cut in half in 2013–2014, decreasing to $3,208. The cutoff staffing levels used to determine the largest cohort of libraries, after declining in every year since 1995–96, continued to hold steady at over 110 in 2013–2014.4 Geographic Area In 2013–2014, the highest average salaries were found in Canada ($93,154) followed by New England ($82,030) with salaries in the Middle Atlantic region ($80,261) coming in third (see Table 27). The Canadian average salary peaked again this year, reflecting another all-time high. For the 2013–2014 survey period, the Canadian currency exchange rate is 1.0046. The West South Central region had the lowest average salary: $65,314. Rank Structure Rank structure provides a useful framework for examining professional salaries in ARL university libraries. Figure 6, below, displays average salary and years of experience in the most commonly used rank structures. Readers should be aware that not all individuals have a rank that fits into the rank structure the library utilizes. Most commonly, directors may have no rank (or a rank outside the structure) and it is common for non-librarians included in the survey (business officers, personnel staff, computer specialists, liaisons, etc.) to be unranked, as well. The pattern of relationships between rank and salary seen in past years continues: with higher rank associated with higher average years of experience and a correspondingly higher salary. Of the 10,168 librarians in ARL university member libraries, 6,077 occupy a rank within these three most commonly found ranking systems, and the largest number of professionals (3,072) occupy a position in a four-step rank structure. Figure 6a: Average Salaries and Average Years of Experience of Library Professionals in Libraries with Three, Four, and Five Step Rank Structures, FY 2013–2014 Three-Step Four-Step Five-Step Salary Experience No. of Staff Salary Experience No. of Staff Salary Experience No. of Staff Librarian 1 63,981 8.0 467 58,020 8.4 450 56,948 11.7 235 Librarian 2 76,072 18.1 637 66,597 12.8 867 61,535 12.9 290 Librarian 3 91,890 24.6 404 78,728 20.0 1,166 73,616 17.3 525 Librarian 4 ...94,297 27.0 589 88,246 23.1 320 Librarian 5 ......107,274 28.1 127 No. of Staff 1,508 3,072 1,497 The direct relationship between rank and salary is highlighted even more in the three tables below, which show average salary by percentile in each of the three rank structures presented in Figure 6. Figure 6b: Average Salary by Percentile in Libraries with Three Step Rank Structures, FY 2013–2014 No. of Staff Low 25th Percentile Median 75th Percentile High Librarian 1 467 36,720 51,796 60,160 74,229 125,081 Librarian 2 637 45,000 60,000 70,211 84,991 168,549 Librarian 3 404 35,877 75,972 91,140 105,612 168,303 4 In 1995–96, the largest cohort of libraries was determined based on staff over 124 in 1996–98, over 120 in 1998–99, over 115 and since 1999–2000, over 110. See Table 23.
Help