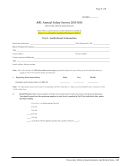
ARL Annual Salary Survey 2013–2014
Page130(130 of 170)
130 · ARL Annual Salary Survey 2013–2014 Table 66: Number and Average Salaries of ARL University Law Librarians by Years of Experience and Sex, FY 2013–2014 Women Men Total %of Total Experience Salary No. Salary No. Salary No. 0–3 years 60,840 76 60,807 35 60,830 111 15% 4–7 years 67,705 78 70,677 41 68,729 119 16% 8–11 years 77,396 62 73,802 30 76,224 92 12% 12–15 years 83,767 34 84,594 34 84,181 68 9% 16–19 years 84,187 59 95,813 21 87,239 80 11% 20–23 years 80,052 38 88,657 21 83,115 59 8% 24–27 years 94,624 35 99,197 29 96,696 64 8% 28–31 years 88,164 27 97,979 17 91,956 44 6% 32–35 years 96,717 39 119,935 19 104,323 58 8% over 35 years 107,569 48 156,234 18 120,841 66 9% All Positions: 81,024 496 89,145 265 83,852 761 100% Canadian salaries are expressed in US dollars.
ARL Annual Salary Survey 2013–2014
Page132(132 of 170)
132 · ARL Annual Salary Survey 2013–2014 ASSOCIATION OF RESEARCH LIBRARIES 1 GENERAL OVERVIEW ARL ANNUAL SALARY SURVEY 2013-2014 University Library Questionnaire GENERAL AND DATA INPUT (CSV) INSTRUCTIONS http://www.arlstatistics.org/About/Mailings/ss_2013-14 Important Initial Information • This year for the second time we are collecting the salary data through the http://arlstatistics.org interface, a change from earlier years when we used Formstack. You also have the option of sending the files to us by email to stats@arl.org if this is your preferred method. • This survey is concerned with professional positions only. Since the criteria for determining professional status vary among libraries, there is no attempt to define the term “professional.” Each library should report the salaries of those staff members it considers professionals, irrespective of faculty status or membership in a collective bargaining unit, including, when appropriate, staff who are not librarians in the strict sense of the term, such as computer experts, systems analysts, budget officers, etc. • Report individual salaries for the Main, Law, and Medical library on separate CSV files using the Microsoft CSV Template at http://www.arlstatistics.org/About/Mailings/ss_2013-14. Add your institution’s ARL Library Institution Code [LibID] to the template. (See http://www.arlstatistics.org/about/instno if you do not know your institution code.) For the first time this year we have added online validation that requires the file format to be CSV. You online submission will be successful only if all the required fields are submitted in CSV. If you run into problems, please do not hesitate to email the files to us. We do not want the online validation to be an impediment to your successful submission. If you want more personalized help in submitting the data as a result of this change, do not hesitate to send an email to stats@arl.org and set up a phone call consultation. • Use “Percent” to determine if an employee works full-time or part-time. All full-time employees have Percent =1.00, i.e., they work 100% of a full-time schedule. If percent is less than 1.00, then the employee works that fraction of a full-time schedule. For example, a 65% time appointment would be entered as 0.65. Calculate the percent appointment by dividing the amount of time an employee works by the amount considered to be the norm for full-time employment at your institution. For example, if a full-time appointment at your institution is 12 months at 40 hours per week: