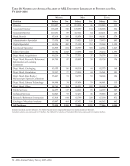
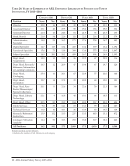
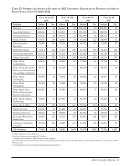
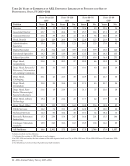
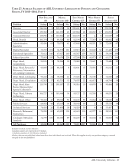
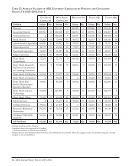
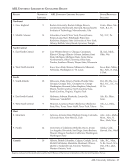
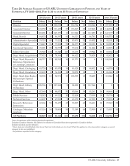
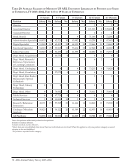
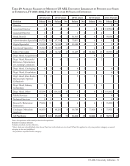
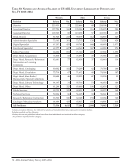
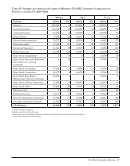
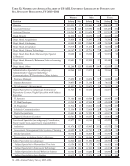
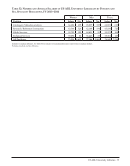
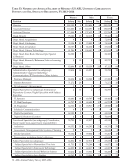
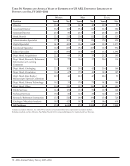
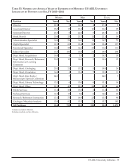
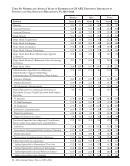
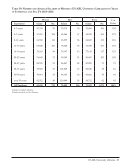
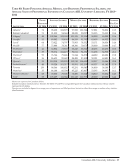
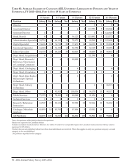
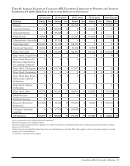
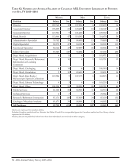
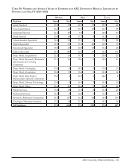
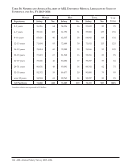
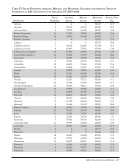
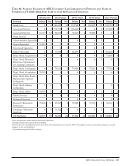
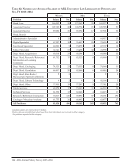
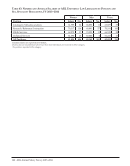
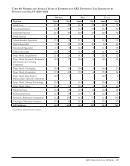
Table 23: Number and Average Salaries of ARL University Librarians by Position and Type of Institution, FY 2013–2014 59 Table 24: Years of Experience of ARL University Librarians by Position and Type of Institution, FY 2013–2014 60 Table 25: Number and Average Salaries of ARL University Librarians by Position and Size of Professional Staff, FY 2013–2014 61 Table 26: Years of Experience of ARL University Librarians by Position and Size of Professional Staff, FY 2013–2014 62 Table 27: Average Salaries of ARL University Librarians by Position and Geographic Region, FY 2013–2014, Part 1 63 Table 27: Average Salaries of ARL University Librarians by Position and Geographic Region, FY 2013–2014, Part 2 64 ARL University Libraries by Geographic Region 65 US ARL University Libraries 67 Table 28: Average Salaries of US ARL University Librarians by Position and Years of Experience, FY 2013–2014, Part 1: 0 to 19 Years of Experience 68 Table 28: Average Salaries of US ARL University Librarians by Position and Years of Experience, FY 2013–2014, Part 2: 20 to over 35 Years of Experience 69 Table 29: Average Salaries of Minority US ARL University Librarians by Position and Years of Experience, FY 2013–2014, Part 1: 0 to 19 Years of Experience 70 Table 29: Average Salaries of Minority US ARL University Librarians by Position and Years of Experience, FY 2013–2014, Part 2: 20 to over 35 Years of Experience 71 Table 30: Number and Average Salaries of US ARL University Librarians by Position and Sex, FY 2013–2014 72 Table 31: Number and Average Salaries of Minority US ARL University Librarians by Position and Sex, FY 2013–2014 73 Table 32: Number and Average Salaries of US ARL University Librarians by Position and Sex, Specialist Breakdown, FY 2013–2014 74 Table 33: Number and Average Salaries of Minority US ARL University Librarians by Position and Sex, Specialist Breakdown, FY 2013–2014 76 Table 34: Number and Average Years of Experience of US ARL University Librarians by Position and Sex, FY 2013–2014 78 Table 35: Number and Average Years of Experience of Minority US ARL University Librarians by Position and Sex, FY 2013–2014 79
Help