
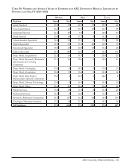
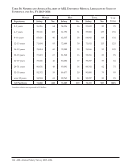
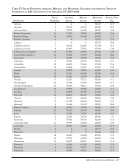
ARL Nonuniversity Libraries Tables 5–6
Help


Powered by Tizra® |