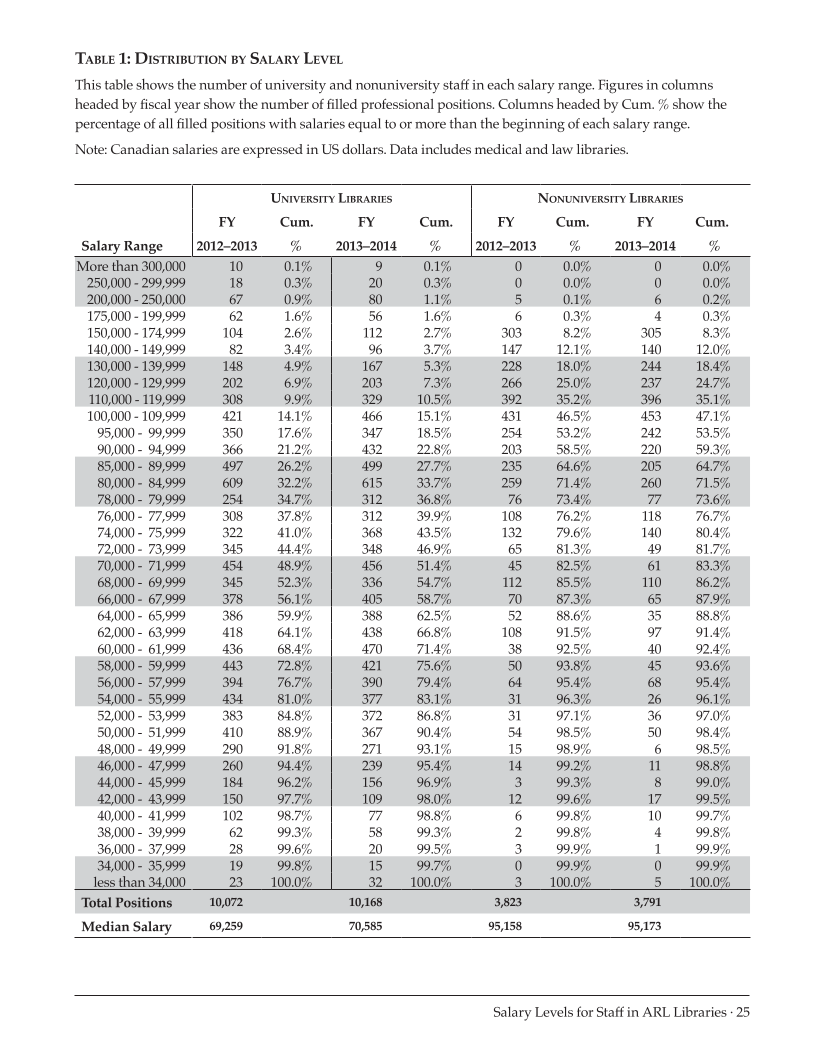
Salary Levels for Staff in ARL Libraries · 25 Table 1: Distribution by Salary Level This table shows the number of university and nonuniversity staff in each salary range. Figures in columns headed by fiscal year show the number of filled professional positions. Columns headed by Cum. %show the percentage of all filled positions with salaries equal to or more than the beginning of each salary range. Note: Canadian salaries are expressed in US dollars. Data includes medical and law libraries. University Libraries Nonuniversity Libraries FY Cum. FY Cum. FY Cum. FY Cum. Salary Range 2012–2013 %2013–2014 %2012–2013 %2013–2014 %More than 300,000 10 0.1% 9 0.1% 0 0.0% 0 0.0% 250,000 -299,999 18 0.3% 20 0.3% 0 0.0% 0 0.0% 200,000 -250,000 67 0.9% 80 1.1% 5 0.1% 6 0.2% 175,000 -199,999 62 1.6% 56 1.6% 6 0.3% 4 0.3% 150,000 -174,999 104 2.6% 112 2.7% 303 8.2% 305 8.3% 140,000 -149,999 82 3.4% 96 3.7% 147 12.1% 140 12.0% 130,000 -139,999 148 4.9% 167 5.3% 228 18.0% 244 18.4% 120,000 -129,999 202 6.9% 203 7.3% 266 25.0% 237 24.7% 110,000 -119,999 308 9.9% 329 10.5% 392 35.2% 396 35.1% 100,000 -109,999 421 14.1% 466 15.1% 431 46.5% 453 47.1% 95,000 -99,999 350 17.6% 347 18.5% 254 53.2% 242 53.5% 90,000 -94,999 366 21.2% 432 22.8% 203 58.5% 220 59.3% 85,000 -89,999 497 26.2% 499 27.7% 235 64.6% 205 64.7% 80,000 -84,999 609 32.2% 615 33.7% 259 71.4% 260 71.5% 78,000 -79,999 254 34.7% 312 36.8% 76 73.4% 77 73.6% 76,000 -77,999 308 37.8% 312 39.9% 108 76.2% 118 76.7% 74,000 -75,999 322 41.0% 368 43.5% 132 79.6% 140 80.4% 72,000 -73,999 345 44.4% 348 46.9% 65 81.3% 49 81.7% 70,000 -71,999 454 48.9% 456 51.4% 45 82.5% 61 83.3% 68,000 -69,999 345 52.3% 336 54.7% 112 85.5% 110 86.2% 66,000 -67,999 378 56.1% 405 58.7% 70 87.3% 65 87.9% 64,000 -65,999 386 59.9% 388 62.5% 52 88.6% 35 88.8% 62,000 -63,999 418 64.1% 438 66.8% 108 91.5% 97 91.4% 60,000 -61,999 436 68.4% 470 71.4% 38 92.5% 40 92.4% 58,000 -59,999 443 72.8% 421 75.6% 50 93.8% 45 93.6% 56,000 -57,999 394 76.7% 390 79.4% 64 95.4% 68 95.4% 54,000 -55,999 434 81.0% 377 83.1% 31 96.3% 26 96.1% 52,000 -53,999 383 84.8% 372 86.8% 31 97.1% 36 97.0% 50,000 -51,999 410 88.9% 367 90.4% 54 98.5% 50 98.4% 48,000 -49,999 290 91.8% 271 93.1% 15 98.9% 6 98.5% 46,000 -47,999 260 94.4% 239 95.4% 14 99.2% 11 98.8% 44,000 -45,999 184 96.2% 156 96.9% 3 99.3% 8 99.0% 42,000 -43,999 150 97.7% 109 98.0% 12 99.6% 17 99.5% 40,000 -41,999 102 98.7% 77 98.8% 6 99.8% 10 99.7% 38,000 -39,999 62 99.3% 58 99.3% 2 99.8% 4 99.8% 36,000 -37,999 28 99.6% 20 99.5% 3 99.9% 1 99.9% 34,000 -35,999 19 99.8% 15 99.7% 0 99.9% 0 99.9% less than 34,000 23 100.0% 32 100.0% 3 100.0% 5 100.0% Total Positions 10,072 10,168 3,823 3,791 Median Salary 69,259 70,585 95,158 95,173
Help


