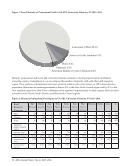
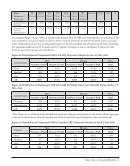
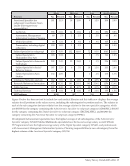
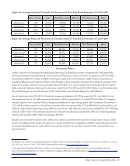
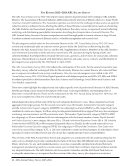
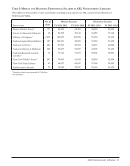
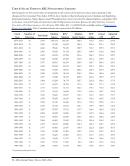
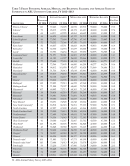
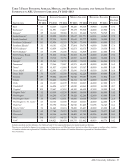
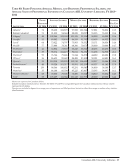
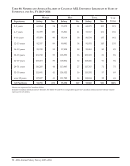
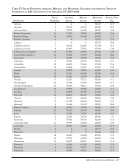
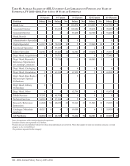
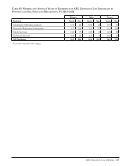
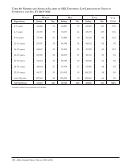
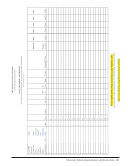
10 · ARL Annual Salary Survey 2013–2014 Figure 1: Race/Ethnicity of Professional Staff in US ARL University Libraries, FY 2013–2014 Caucasian/Other 85.4% American Indian or Native Alaskan 0.4% Asian or Pacific Islander 6.9% Hispanic 2.9% Black 4.4% Minority professional staff in US ARL university libraries continues to be disproportionately distributed across the country. Using Figure 2, we can compare the number of minority staff with other staff, region by region. These patterns of distribution have been relatively stable for the entire history of ARL’s data-collection experience. Minorities are underrepresented by almost 41% in the West North Central region and by 31% in the New England region (see Table 27 for a definition of the regions). Proportionately to other regions, there are more minorities in the Pacific, South Atlantic, and West South Central regions. Figure 2: Minority Professionals by Region in US ARL University Libraries, FY 2013–2014 Race/ Ethnicity Category New England Middle Atlantic East North Central West North Central South Atlantic East South Central West South Central Mountain Pacific Total %Black 26 64 66 21 127 25 26 9 31 395 30% Hispanic 21 44 30 8 41 9 38 22 44 257 20% Asian 81 106 83 18 90 11 44 19 166 618 47% American Indian/Alaskan Native 5 4 4 4 1 3 9 2 32 2% Minority Total 133 218 183 51 259 45 111 59 243 1,302 100.0% Minority Percent 10.2% 16.7% 14.1% 3.9% 19.9% 3.5% 8.5% 4.5% 18.7% Nonminority Total 1,125 1,243 1,281 503 1,314 365 619 434 763 7,647 100.0% Nonminority Percent 14.7% 16.3% 16.8% 6.6% 17.2% 4.8% 8.1% 5.7% 10.0%
Help