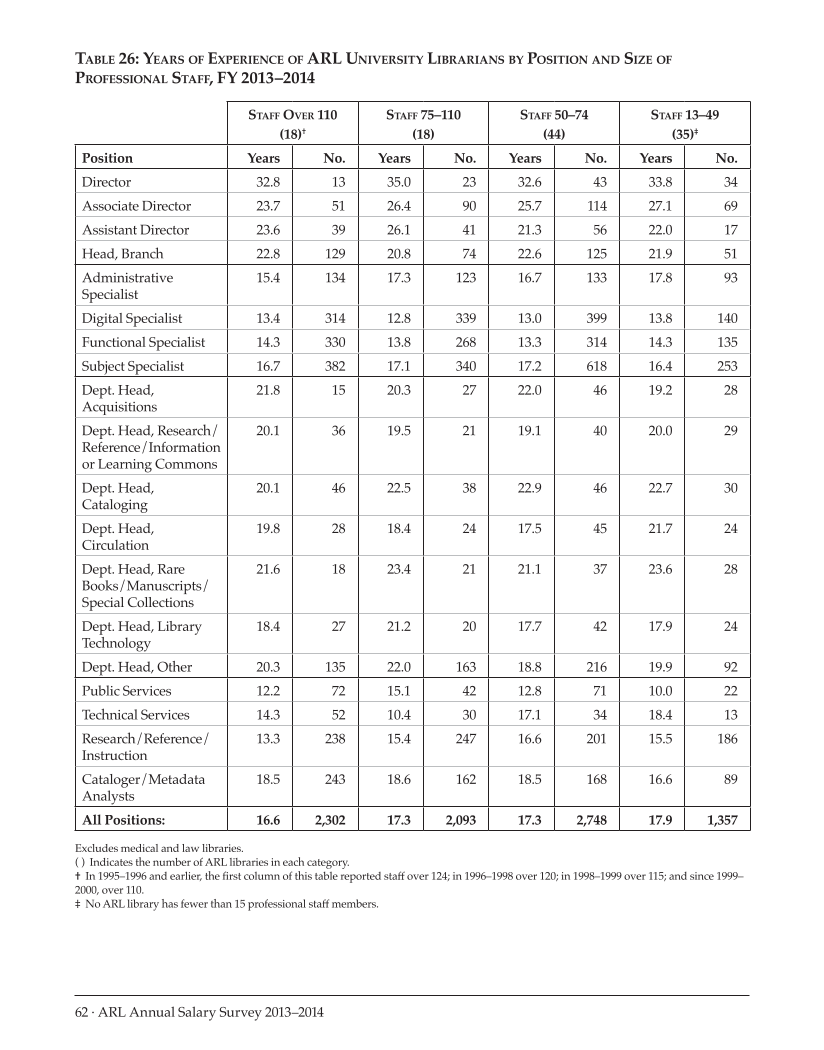
62 · ARL Annual Salary Survey 2013–2014 Table 26: Years of Experience of ARL University Librarians by Position and Size of Professional Staff, FY 2013–2014 Staff Over 110 (18)† Staff 75–110 (18) Staff 50–74 (44) Staff 13–49 (35)‡ Position Years No. Years No. Years No. Years No. Director 32.8 13 35.0 23 32.6 43 33.8 34 Associate Director 23.7 51 26.4 90 25.7 114 27.1 69 Assistant Director 23.6 39 26.1 41 21.3 56 22.0 17 Head, Branch 22.8 129 20.8 74 22.6 125 21.9 51 Administrative Specialist 15.4 134 17.3 123 16.7 133 17.8 93 Digital Specialist 13.4 314 12.8 339 13.0 399 13.8 140 Functional Specialist 14.3 330 13.8 268 13.3 314 14.3 135 Subject Specialist 16.7 382 17.1 340 17.2 618 16.4 253 Dept. Head, Acquisitions 21.8 15 20.3 27 22.0 46 19.2 28 Dept. Head, Research/ Reference/Information or Learning Commons 20.1 36 19.5 21 19.1 40 20.0 29 Dept. Head, Cataloging 20.1 46 22.5 38 22.9 46 22.7 30 Dept. Head, Circulation 19.8 28 18.4 24 17.5 45 21.7 24 Dept. Head, Rare Books/Manuscripts/ Special Collections 21.6 18 23.4 21 21.1 37 23.6 28 Dept. Head, Library Technology 18.4 27 21.2 20 17.7 42 17.9 24 Dept. Head, Other 20.3 135 22.0 163 18.8 216 19.9 92 Public Services 12.2 72 15.1 42 12.8 71 10.0 22 Technical Services 14.3 52 10.4 30 17.1 34 18.4 13 Research/Reference/ Instruction 13.3 238 15.4 247 16.6 201 15.5 186 Cataloger/Metadata Analysts 18.5 243 18.6 162 18.5 168 16.6 89 All Positions: 16.6 2,302 17.3 2,093 17.3 2,748 17.9 1,357 Excludes medical and law libraries. ()Indicates the number of ARL libraries in each category. † In 1995–1996 and earlier, the first column of this table reported staff over 124 in 1996–1998 over 120 in 1998–1999 over 115 and since 1999– 2000, over 110. ‡ No ARL library has fewer than 15 professional staff members.
Help


