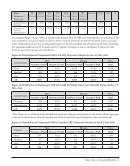
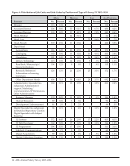
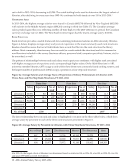
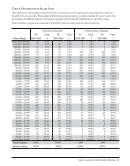
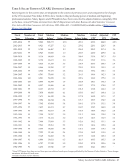
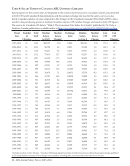
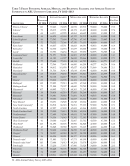
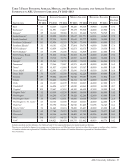
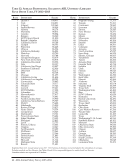
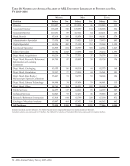
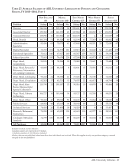
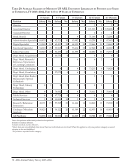
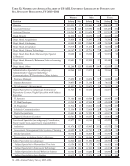
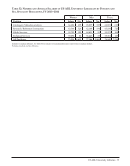
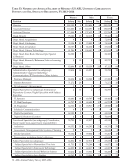
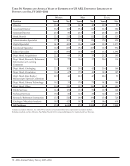
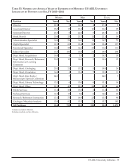
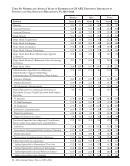
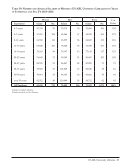
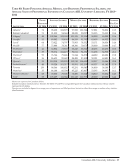
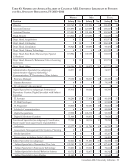
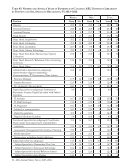
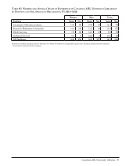
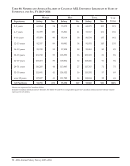
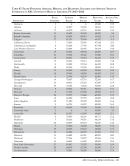
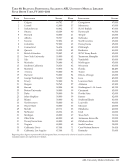
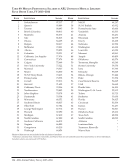
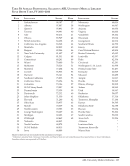
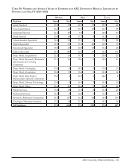
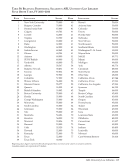
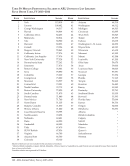
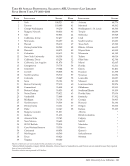
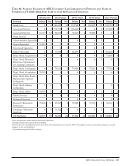
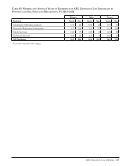
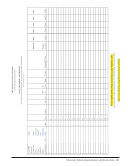
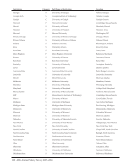
ARL University Libraries · 37 Filled Positions Average Salaries Median Salaries Beginning Salaries Average Yrs. Exp. Institution FY 2014 FY 2013 FY 2014 FY 2013 FY 2014 FY 2013 FY 2014 FY 2014 Rice 63 63,227 64,409 58,420 59,325 39,900 40,300 17.2 Rochester‡ 61 61,591 61,417 59,175 59,528 40,000 47,500 17.4 Rutgers‡ 85 94,340 95,004 92,311 92,443 50,765 50,765 22.1 Saskatchewan‡ 48 98,958 100,853 95,637 101,771 60,314 60,862 17.0 South Carolina‡ 52 57,334 58,990 53,643 55,777 38,000 38,000 15.1 Southern California‡ 110 82,956 83,333 74,280 75,990 49,000 49,000 21.2 Southern Illinois‡ 31 60,101 62,261 57,864 59,076 44,000 50,000 17.6 SUNY Albany‡ 69 63,059 63,596 62,073 62,073 39,350 39,350 18.3 SUNY Buffalo‡ 65 77,398 76,258 75,041 73,869 47,000 47,000 19.3 SUNY Stony Brook 18 91,030 87,042 82,583 81,338 45,000 45,000 19.2 Syracuse‡ 58 70,710 70,758 63,957 64,825 38,000 38,000 17.6 Temple‡ 49 71,261 74,792 62,000 70,039 44,044 44,044 17.3 Tennessee‡ 45 72,366 72,847 69,975 68,639 48,000 48,000 16.3 Texas‡ 135 61,037 61,884 55,690 57,047 48,000 46,000 14.8 Texas A&M‡ 107 62,004 67,078 55,696 59,018 49,500 50,500 16.4 Texas Tech‡ 70 63,507 65,358 61,042 62,220 49,000 49,000 13.8 Toronto 139 98,004 100,390 94,940 99,087 56,591 57,834 13.7 Tulane 37 66,266 66,854 62,311 62,728 42,000 44,000 17.1 Utah 62 65,107 66,199 59,583 60,867 46,000 47,000 17.7 Vanderbilt‡ 62 66,294 67,177 60,020 60,863 42,500 42,500 20.7 Virginia‡ 102 72,647 67,853 68,100 64,600 47,500 52,000 18.2 Virginia Tech‡ 52 63,559 63,230 58,800 58,000 40,000 44,000 14.2 Washington 113 64,290 67,367 58,428 62,244 42,600 45,000 19.9 Washington State‡ 38 63,493 63,851 60,000 60,000 39,500 40,000 21.0 Washington U.-St. Louis‡ 65 60,765 65,690 55,825 60,067 40,000 42,000 17.9 Waterloo‡ 35 85,790 85,162 84,910 87,405 53,198 54,745 16.1 Wayne State‡ 52 61,243 65,274 58,200 63,407 45,000 45,000 14.8 Western‡ 68 77,742 78,973 76,208 77,259 54,608 55,377 14.5 Wisconsin‡ 129 62,156 66,058 58,409 61,785 41,336 45,000 18.1 Yale‡ 194 83,157 84,722 78,238 80,611 51,500 55,000 19.5 York‡ 58 104,821 110,874 100,755 111,462 48,819 48,776 14.2 Excludes medical and law libraries. See Tables 47 and 57 for comparable figures for medical and law libraries. Directors are included in figures for average years of experience and filled positions, but not in either the average or median salary statistics. † Canadian salaries are expressed in US dollars. See Table 40 for salaries of Canadian librarians expressed in Canadian dollars. ‡ See Footnotes. Table 7: Filled Positions Average, Median, and Beginning Salaries and Average Years of Experience in ARL University Libraries, FY 2012–2013
Help