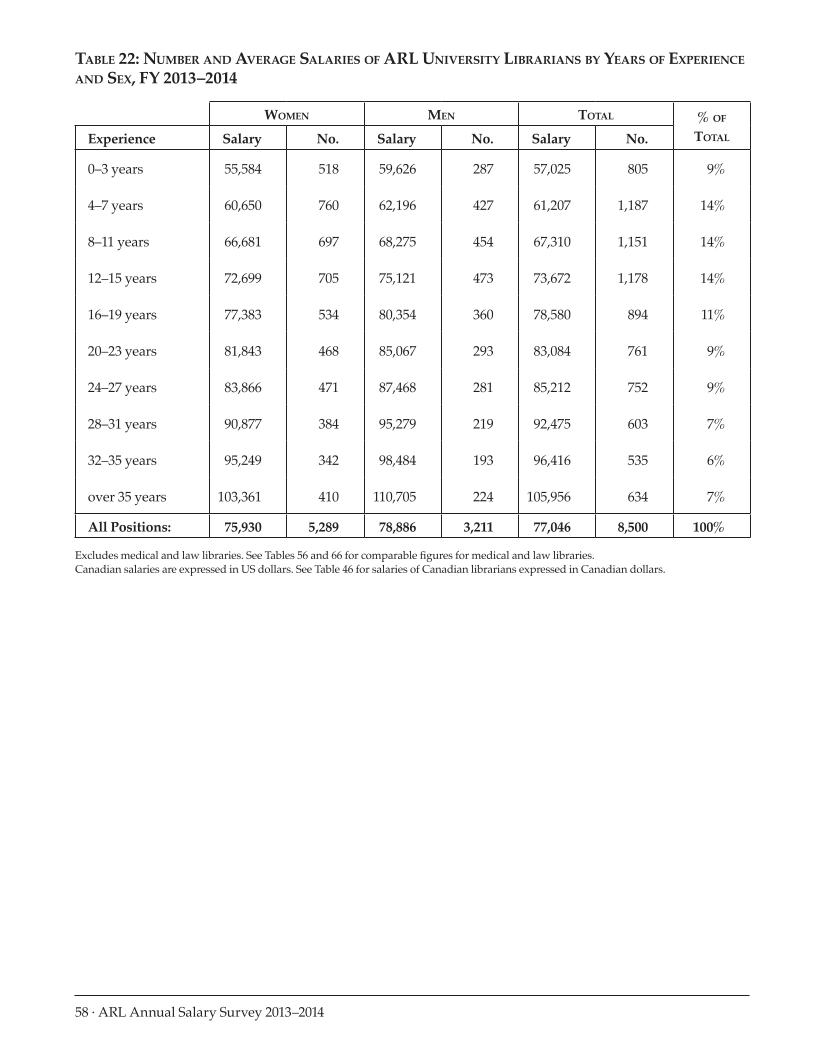
58 · ARL Annual Salary Survey 2013–2014 Table 22: Number and Average Salaries of ARL University Librarians by Years of Experience and Sex, FY 2013–2014 Women Men Total %of Total Experience Salary No. Salary No. Salary No. 0–3 years 55,584 518 59,626 287 57,025 805 9% 4–7 years 60,650 760 62,196 427 61,207 1,187 14% 8–11 years 66,681 697 68,275 454 67,310 1,151 14% 12–15 years 72,699 705 75,121 473 73,672 1,178 14% 16–19 years 77,383 534 80,354 360 78,580 894 11% 20–23 years 81,843 468 85,067 293 83,084 761 9% 24–27 years 83,866 471 87,468 281 85,212 752 9% 28–31 years 90,877 384 95,279 219 92,475 603 7% 32–35 years 95,249 342 98,484 193 96,416 535 6% over 35 years 103,361 410 110,705 224 105,956 634 7% All Positions: 75,930 5,289 78,886 3,211 77,046 8,500 100% Excludes medical and law libraries. See Tables 56 and 66 for comparable figures for medical and law libraries. Canadian salaries are expressed in US dollars. See Table 46 for salaries of Canadian librarians expressed in Canadian dollars.
Help


