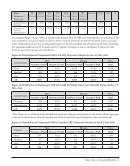
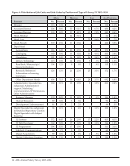
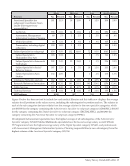
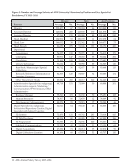
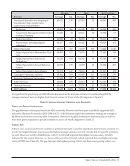
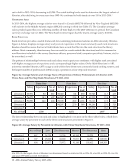
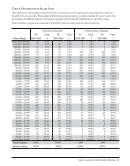
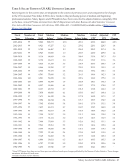
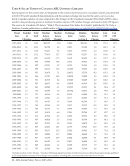
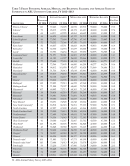
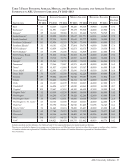
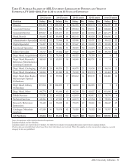
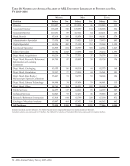
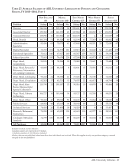
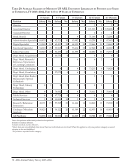
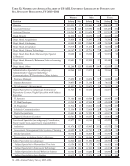
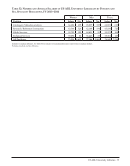
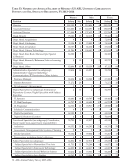
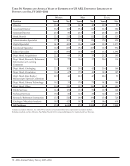
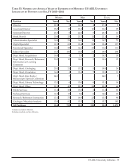
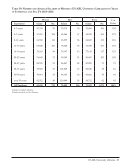
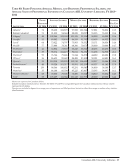
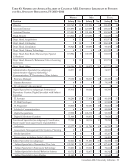
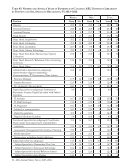
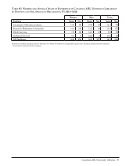
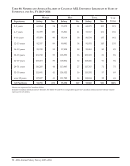
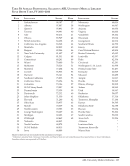
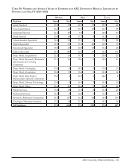
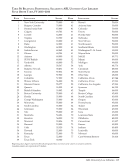
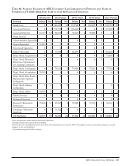
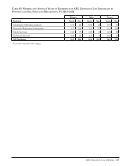
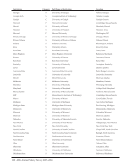
Salary Survey Trends 2013–2014 · 17 Position Women Men All Positions Average No. Average No. Average No. Functional Specialist (no subgroup) Coordinator, Team Leader (non- supervisory responsibility) 63,621 136 67,510 72 64,967 208 Archivists 62,803 366 66,906 220 64,344 586 Assessment, Management Information Systems, Planning 71,836 43 68,441 20 70,758 63 Media Specialists 60,580 43 58,652 62 59,441 105 Preservation, including digital collections 63,477 108 69,022 43 65,056 151 Subject Specialist 69,073 707 73,259 336 70,422 1,043 Subject Specialist in Humanities/Fine Arts 69,503 121 74,792 73 71,493 194 Subject Specialist in Sciences &Technology 66,326 168 69,242 68 67,166 236 Subject Specialist in Social/Behavior Science 66,690 139 72,690 64 68,582 203 Subject Specialist in Area Studies 71,573 107 72,476 66 71,917 173 Catalogers/Metadata analysts 65,466 504 67,487 211 66,062 715 Research/Reference/Instruction 67,848 927 66,795 329 67,572 1,256 Public Services 64,936 189 65,613 89 65,153 278 Technical Services 60,446 114 57,279 41 59,608 155 All Positions: 76,123 6,473 79,344 3,695 77,294 10,168 In regards to the gender gap in ARL libraries discussed in the previous section, it is worth noting that the average salaries of men are higher than those of women in 26 out of the 38 categories in Figure 5. Institutional Characteristics and Salaries Public and Private Institutions The gap between salaries paid in private ARL university libraries and those paid in publicly supported ARL university libraries decreased in 2013–2014 to 8.7%, with librarians at private institutions earning an average of $6,298 more than their peers at public institutions. Librarians in public institutions systematically earned less than their peers employed in private institutions across all 19 job categories in Table 23. Library Size Library size, as measured by the number of professional staff, is another significant determinant of salary. As a rule, the largest libraries tend to pay the highest average salaries, not only overall, but for specific positions as well. However, in 2013–2014 libraries with 75 to 100 staff reported the highest average salary, $78,283, followed by the largest libraries, i.e., those with more than 110 staff, which reported the next highest average salary $77,888 (see Table 25). The gap between the highest paying cohort and the lowest paying cohort was
Help