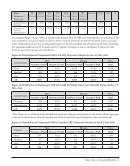
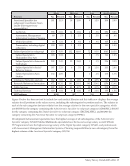
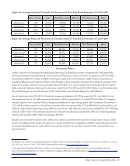
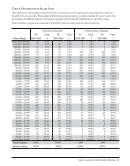
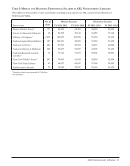
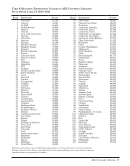
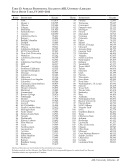
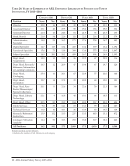
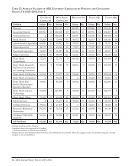
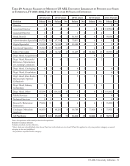
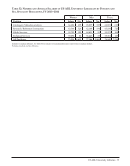
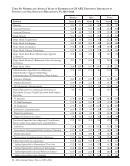
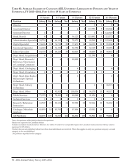
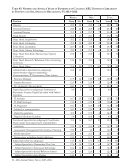
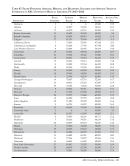
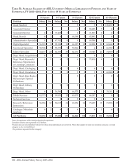
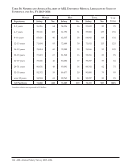
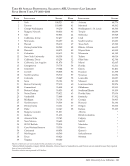
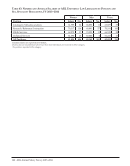
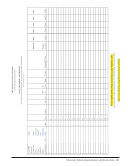
60 · ARL Annual Salary Survey 2013–2014 Table 24: Years of Experience of ARL University Librarians by Position and Type of Institution, FY 2013–2014 Canadian (16) Private (31) Public (68) Total (115) Position Years No. Years No. Years No. Years No. Director 30.8 16 32.2 30 34.7 67 33.5 113 Associate Director 23.1 40 27.5 98 25.6 186 25.8 324 Assistant Director 21.4 16 24.6 81 21.9 56 23.3 153 Head, Branch 21.0 54 22.6 111 22.3 214 22.2 379 Administrative Specialist 14.0 54 16.3 171 17.6 258 16.7 483 Digital Specialist 12.7 115 13.2 418 13.2 659 13.2 1,192 Functional Specialist 15.6 73 13.8 399 13.6 575 13.9 1,047 Subject Specialist 14.9 200 18.1 499 16.7 894 16.9 1,593 Dept. Head, Acquisitions 18.9 13 19.3 36 22.2 67 20.9 116 Dept. Head, Research/ Reference/Information or Learning Commons 16.5 12 20.9 47 19.4 67 19.7 126 Dept. Head, Cataloging 25.4 16 20.1 67 22.9 77 22.0 160 Dept. Head, Circulation 19.7 14 17.2 39 20.0 68 19.0 121 Dept. Head, Rare Books/Manuscripts/ Special Collections 20.1 11 22.6 34 22.6 59 22.3 104 Dept. Head, Library Technology 22.1 9 16.8 40 19.1 64 18.5 113 Dept. Head, Other 20.5 85 19.9 184 20.2 337 20.2 606 Public Services 9.0 39 14.1 69 13.3 99 12.8 207 Technical Services 11.0 10 18.1 36 13.4 83 14.5 129 Research/Reference/ Instruction 13.9 152 15.5 237 15.3 483 15.1 872 Cataloger/Metadata Analysts 14.4 52 18.3 293 18.8 317 18.2 662 All Positions: 16.2 981 17.5 2,889 17.3 4,630 17.2 8,500 Excludes medical and law libraries. ()Indicates the number of ARL libraries in each category.
Help