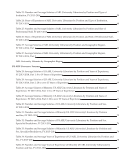
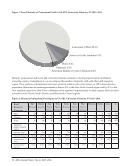
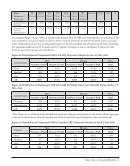
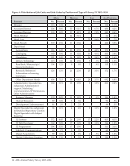
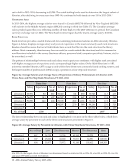
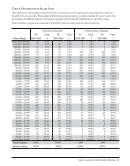
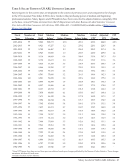
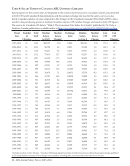
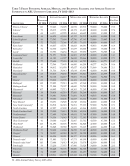
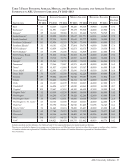
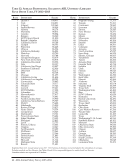
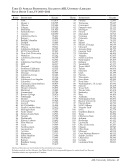
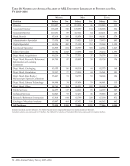
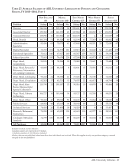
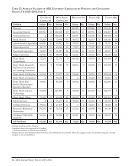
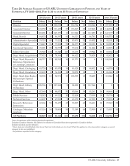
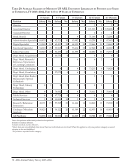
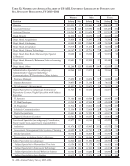
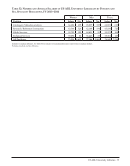
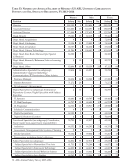
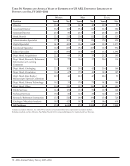
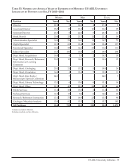
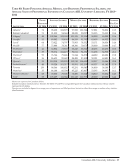
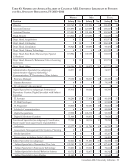
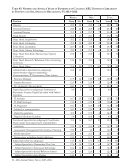
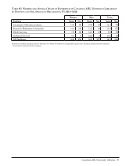
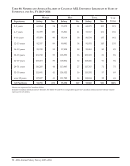
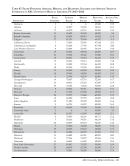
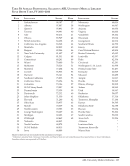
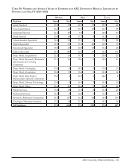
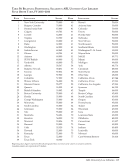
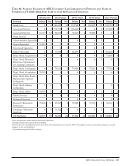
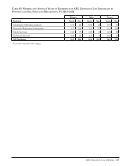
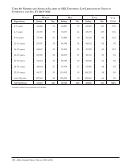
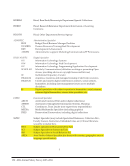
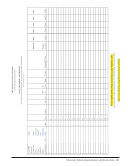
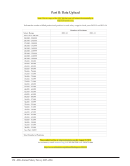
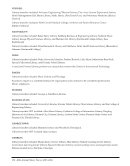
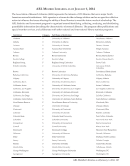
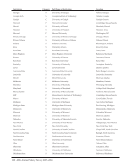
118 · ARL Annual Salary Survey 2013–2014 Institution Filled Positions Average Salary Median Salary Beginning Salary Average Yrs. Exp. New Mexico 6 70,695 71,760 50,000 11.2 New York University 19 84,338 77,328 70,000 23.7 North Carolina 11 78,710 72,779 45,000 13.4 Northwestern 9 74,534 70,298 50,000 22.1 Notre Dame 13 75,822 71,225 48,000 19.7 Ohio State 8 62,784 59,670 48,000 10.1 Oklahoma 7 59,551 52,852 42,000 18.9 Oregon 8 55,566 54,000 45,000 16.5 Ottawa 4 ‡ ‡ 60,204 20.5 Pennsylvania 15 73,161 71,840 45,000 16.9 Pennsylvania State 7 84,940 77,262 65,000 24.3 Queen`s 3 ‡ ‡ 55,292 13.7 Rutgers, Camden 7 71,831 71,050 70,000 16.9 Rutgers, Newark 9 89,026 78,863 58,451 19.4 Saskatchewan 3 ‡ ‡ 60,862 34.3 South Carolina 11 67,682 71,870 55,000 12.6 Southern Illinois 5 59,109 55,530 50,000 9.2 SUNY Buffalo 12 70,518 67,036 60,000 16.8 Syracuse 10 61,054 57,781 46,700 17.4 Temple 10 68,084 56,960 46,000 27.2 Tennessee 10 79,344 77,076 55,000 13.8 Texas 16 69,426 59,000 52,000 14.9 Texas Tech 7 67,390 63,825 50,500 13.1 Toronto 6 103,480 108,602 57,834 15.8 Tulane 8 64,016 63,395 45,000 14.6 Utah 8 67,939 67,670 52,520 15.9 Vanderbilt 6 75,448 68,500 60,000 18.7 Virginia 16 69,100 66,700 63,500 15.7 Washington 18 69,540 64,512 62,000 20.8 Washington U.-St. Louis 8 68,360 62,850 50,000 23.6 Wayne State 5 65,810 62,585 50,000 23.8 Western Ontario 2 ‡ ‡ 55,377 23.0 Wisconsin 12 64,140 61,638 45,000 21.1 Yale 21 87,866 80,500 55,000 15.4 York 5 108,521 115,018 48,776 12.6 Directors are included in figures for filled positions and average years of experience, but not in either the average or median salary statistics. Canadian salaries are expressed in US dollars. ‡ Salary data are not published when fewer than four individuals are involved. Table 57: Filled Positions Average, Median, and Beginning Salaries and Average Years of Experience in ARL University Law Libraries, FY 2013–2014
Help