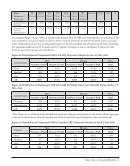
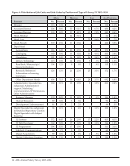
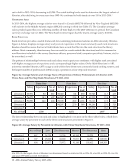
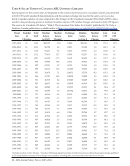
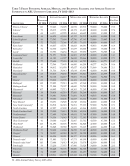
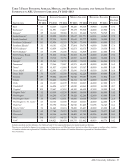
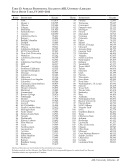
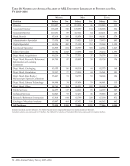
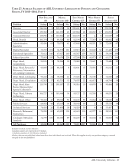
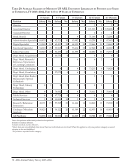
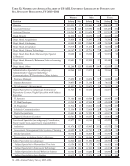
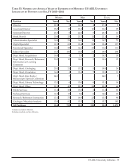
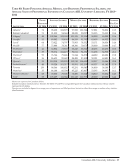
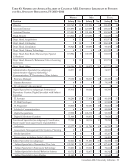
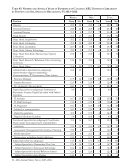
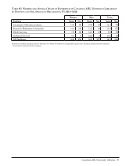
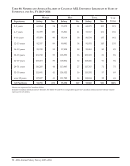
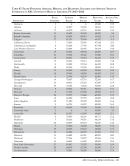
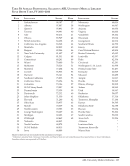
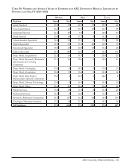
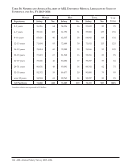
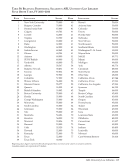
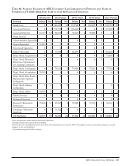
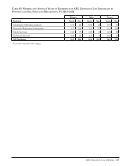
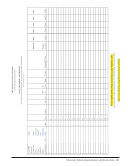
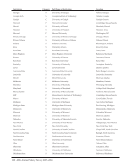
102 · ARL Annual Salary Survey 2013–2014 Institution Filled Positions Average Salary Median Salary Beginning Salary Average Yrs. Exp. Ohio State 10 70,977 67,782 48,000 20.1 Oklahoma 7 57,314 60,374 40,000 18.4 Oklahoma State 4 54,788 49,416 38,000 20.5 Ottawa 6 85,929 84,425 60,204 13.3 Pennsylvania 9 72,539 73,358 45,000 22.7 Pennsylvania State 8 61,437 63,600 48,000 12.0 Pittsburgh 27 69,469 64,654 45,000 18.1 Queen`s 5 95,491 95,809 55,292 18.0 Rochester 25 58,057 55,650 45,000 19.1 Rutgers 16 82,246 80,617 50,765 20.6 Saskatchewan 5 98,187 97,317 60,862 14.6 South Carolina 9 52,020 48,093 38,000 17.1 Southern California 15 75,833 66,819 54,636 17.6 Southern Illinois 5 64,729 68,027 41,000 27.4 SUNY Buffalo 11 68,015 63,952 47,000 20.5 SUNY Stony Brook 9 73,007 73,413 45,000 21.2 Temple 10 60,117 60,439 46,000 18.5 Tennessee, Knoxville 4 ‡ ‡ 39,000 16.0 Tennessee, Memphis 11 57,184 60,240 45,000 21.2 Texas Tech 23 51,896 48,502 39,114 19.5 Toronto 16 94,491 90,695 57,834 11.9 Tulane 8 58,969 55,725 44,000 17.6 Utah 15 58,567 56,662 40,000 18.6 Vanderbilt 12 65,104 63,533 45,000 15.9 Virginia 14 66,600 66,800 48,000 23.1 Washington 18 66,947 61,692 45,000 20.2 Washington U.-St. Louis 24 61,998 55,912 42,700 17.2 Wayne State 4 ‡ ‡ 50,000 19.3 Wisconsin 14 65,012 62,959 45,000 16.1 Yale 16 87,412 86,013 55,000 20.3 Directors are included in figures for filled positions and average years of experience, but not in either the average or median salary statistics. Canadian salaries are expressed in US dollars. ‡ Salary data are not published when fewer than four individuals are involved. Table 47: Filled Positions Average, Median, and Beginning Salaries and Average Years of Experience in ARL University Medical Libraries, FY 2013–2014
Help