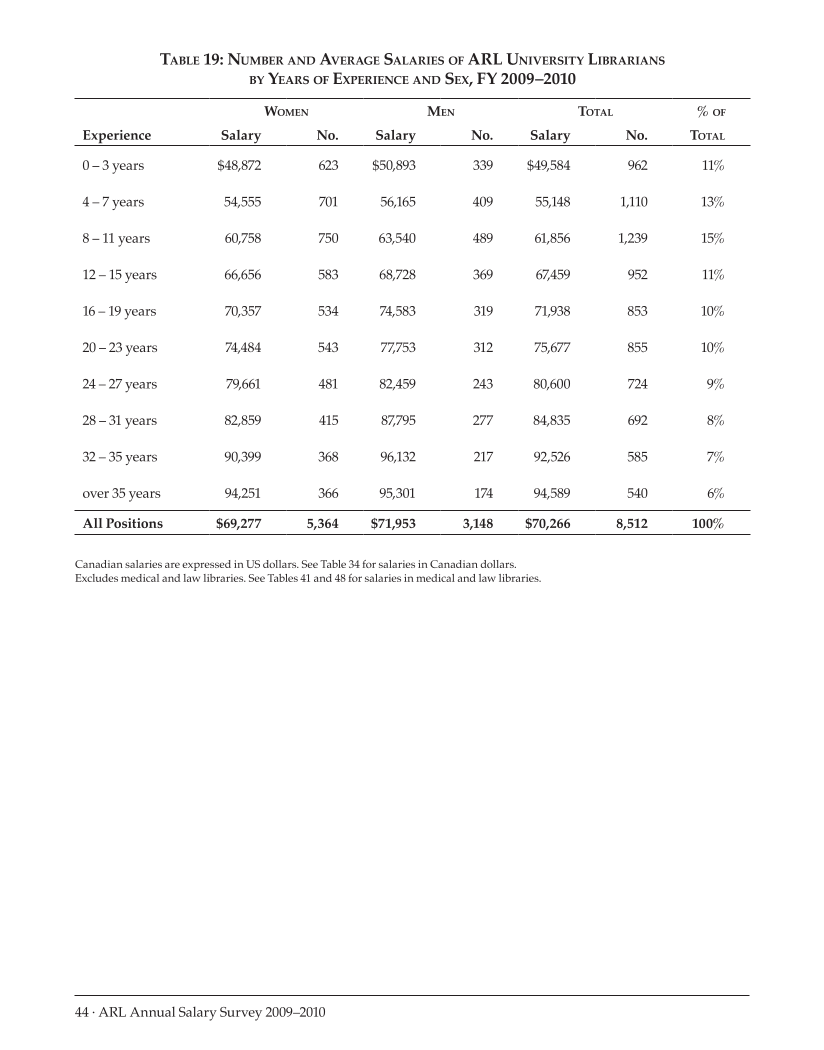
44 · ARL Annual Salary Survey 2009–2010 Table 19: Number and Average Salaries of ARL University Librarians by Years of Experience and Sex, FY 2009–2010 Canadian salaries are expressed in US dollars. See Table 34 for salaries in Canadian dollars. Excludes medical and law libraries. See Tables 41 and 48 for salaries in medical and law libraries. Experience Women Men Total % of Salary No. Salary No. Salary No. Total 0 – 3 years $48,872 623 $50,893 339 $49,584 962 11% 4 – 7 years 54,555 701 56,165 409 55,148 1,110 13% 8 – 11 years 60,758 750 63,540 489 61,856 1,239 15% 12 – 15 years 66,656 583 68,728 369 67,459 952 11% 16 – 19 years 70,357 534 74,583 319 71,938 853 10% 20 – 23 years 74,484 543 77,753 312 75,677 855 10% 24 – 27 years 79,661 481 82,459 243 80,600 724 9% 28 – 31 years 82,859 415 87,795 277 84,835 692 8% 32 – 35 years 90,399 368 96,132 217 92,526 585 7% over 35 years 94,251 366 95,301 174 94,589 540 6% All Positions $69,277 5,364 $71,953 3,148 $70,266 8,512 100%
Help


