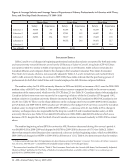
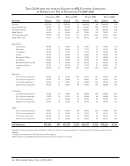
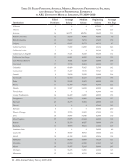
ARL University Libraries · 47 Table 22: Years of Experience of ARL University Librarians by Position and Type of Institution, FY 2009–2010 Excludes medical and law libraries. ( ) Indicates the number of ARL libraries in each category. Canadian (15) Private (31) Public (68) Total (114) Position Years No. Years No. Years No. Years No. Director 32.0 15 32.9 31 33.3 68 33.0 114 Associate Director 23.3 40 26.2 96 25.8 180 25.6 316 Assistant Director 24.2 19 25.2 67 23.8 84 24.4 170 Head, Branch 22.0 60 22.3 132 22.0 295 22.0 487 Functional Specialist 14.4 180 14.0 781 13.2 1,148 13.6 2,109 Subject Specialist 14.7 123 17.2 396 16.3 614 16.4 1,133 Dept. Head: Acquisitions 21.1 15 20.9 28 19.7 69 20.2 112 Reference 18.9 15 21.2 41 20.1 52 20.3 108 Cataloging 24.0 11 21.8 56 21.6 82 21.8 149 Serials 24.0 4 24.3 11 17.4 15 20.8 30 Documents/Maps 25.3 8 17.2 14 20.5 37 20.4 59 Circulation 18.7 14 16.5 18 19.6 51 18.8 83 Rare Books/Manuscripts 23.9 8 21.1 30 23.6 52 22.8 90 Computer Systems 20.7 7 18.8 23 20.0 43 19.7 73 Other 18.3 67 20.4 201 20.2 386 20.1 654 Reference: Over 14 years experience 25.6 83 25.7 150 25.1 343 25.3 576 10 to 14 years experience 12.0 29 11.9 61 11.9 122 11.9 212 5 to 9 years experience 6.9 71 7.1 67 7.1 168 7.0 306 Under 5 years experience 2.3 61 2.6 48 2.6 145 2.5 254 Cataloging: Over 14 years experience 29.2 37 26.0 165 26.4 199 26.5 401 10 to 14 years experience 12.4 10 11.6 47 12.3 49 12.0 106 5 to 9 years experience 6.9 9 7.0 64 6.6 68 6.8 141 Under 5 years experience 2.0 10 2.4 48 2.6 54 2.5 112 Other: Over 14 years experience 25.3 17 23.4 115 25.6 167 24.7 299 10 to 14 years experience 12.1 10 11.7 40 11.8 73 11.8 123 5 to 9 years experience 7.5 12 6.9 51 7.1 68 7.1 131 Under 5 years experience 1.8 12 2.5 53 2.4 99 2.4 164 All Positions 16.5 947 17.2 2,834 17.0 4,731 17.0 8,512
Help