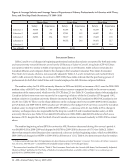
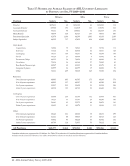
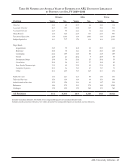
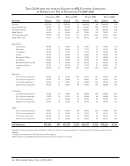
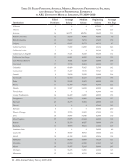
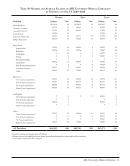
Salary Survey Trends 2009–2010 · 13 Institutional Characteristics and Salaries A. Public and Private Institutions The gap between salaries paid in private US ARL university libraries and those paid in publicly supported US university libraries decreased slightly in 2008–2009 it was 7%, in 2009–2010 the difference was 6%, with an average of $4,120 more paid for a position in a private institution. Out of 27 job categories, only in four (Heads of Documents/Maps, Heads of Rare Books/Manuscripts, Heads of Computer Systems and Other: Over 14 years experience) did librarians in public institutions earn more than their peers employed in private institutions (see Table 21). B. Library Size Library size, as measured by the number of professional staff, is another significant determinant of salary. As a rule, the largest libraries pay the highest average salaries, not only overall, but for specific positions as well.4 The largest libraries, those with more than 110 staff, reported the highest average salary, $72,765, compared to $71,620 for the libraries with between 75 and 110 staff (see Table 23). The smallest libraries (22 to 49 staff) had the third-highest average salary of the cohorts, followed by those libraries with 50 to 74 staff. The gap between the highest paying cohort and the lowest paying cohort remained unchanged, in 2009–2010 it was $4,901, a difference of 6.8% percent (the difference in 2008–2009 was $4,994, which was 7.2%). C. Geographic Area In 2009–2010, the highest average salaries were found in New England ($76,371) followed by the Pacific ($75,283) region with Canadian salaries ($73,363) coming in third (see Table 25). The reason for the drop in Canadian salaries relative to US institutions (highest in 2008–2009 at $82,295) was the change in the currency exchange rate: in the 2008–2009 salary survey it was 1.0101 for the 2009–2010 survey period it is 1.1667.5 The East South Central region had the lowest average salary, with an average of $62,872. D. Rank Structure Rank structure provides a useful framework for examining professional salaries in ARL university libraries. Figure 6, below, displays average salary and years of experience in the three most commonly used rank structures. Readers should be aware that not all individuals have a rank that fits into the rank structure the library utilizes. Most commonly, directors may have no rank (or a rank outside the structure) and it is common for non-librarians included in the survey (business officers, personnel staff, computer specialists, liaisons, etc.) to be unranked, as well. The pattern of relationships between rank and salary seen in past years continues: with higher rank associated with higher average years of experience and a correspondingly higher salary. Of the 8,512 librarians in ARL university member libraries, 6,082 occupy a rank within these three most commonly found ranking systems, and the largest number of professionals (3,223) occupy a position in a four-step rank structure. 4 In 1995–1996, the largest cohort of libraries was determined based on staff over 124 in 1996–1998, over 120 in 1998–1999, over 115 and since 1999–2000, over 110. See Table 23. 5 This is the average monthly noon exchange rate published in the Bank of Canada Review for the period July 2008–June 2009 and is used in converting figures that are shown effective as of 1 July 2009. This information can be accessed at: http:// www.bankofcanada.ca/en/rates/exchange.html.
Help