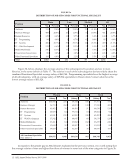
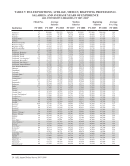
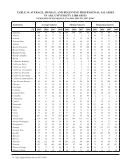
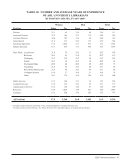
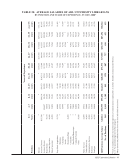
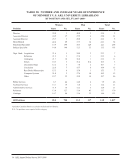
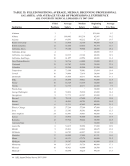
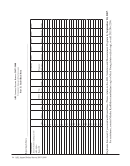
60 · ARL Annual Salary Survey 2007–2008 TABLE 31: FILLED POSITIONS AVERAGE, MEDIAN, AND BEGINNING PROFESSIONAL SALARIES AND AVERAGE YEARS OF PROFESSIONAL EXPERIENCE IN CANADIAN ARL UNIVERSITY LIBRARIES, FY 2007-08* Filled Positions Average Salaries Median Salaries Beginning Salaries Average Yrs. Exp. Institution FY 2008 FY 2007 FY 2008 FY2007 FY2008 FY2007 FY2008 FY 2008 Alberta ‡ 67 $80,505 $84,681 $89,210 $93,456 $47,038 48,685 17.3 British Columbia ‡ 83 74,244 78,598 73,190 77,831 50,839 51,841 15.3 Guelph ‡ 48 72,489 70,281 68,416 65,980 43,695 43,695 17.2 Laval 61 62,928 67,519 64,953 71,012 42,683 45,320 16.6 McGill ‡ 53 74,312 74,744 77,013 73,291 46,000 46,000 18.5 McMaster ‡ 22 71,409 76,486 70,987 78,325 42,226 43,704 18.9 Manitoba ‡ 45 84,050 87,483 87,001 89,632 45,158 46,799 23.8 Montreal ‡ 85 66,179 68,235 63,214 65,918 40,124 40,926 14.9 Queen’s ‡ 35 78,481 81,829 79,890 83,878 44,715 46,079 18.7 Saskatchewan ‡ 40 75,513 84,386 74,832 84,307 41,807 47,101 17.0 Toronto ‡ 136 86,489 86,859 89,880 88,821 48,700 48,700 17.2 Waterloo ‡ 34 75,980 77,455 77,954 79,343 45,734 47,198 18.9 Western Ontario ‡ 63 63,053 66,739 57,992 61,423 47,630 46,000 14.6 York ‡ 56 85,643 92,462 80,763 86,615 42,225 43,275 16.5 * Salaries expressed in Canadian dollars. Directors are included in figures for average years of experience and filled positions, but not in the average and median salary statistics. Excludes Canadian medical and law libraries. See Tables 35 and 42 for statistics related to medical and law library salaries. ‡ See Footnotes.
Help