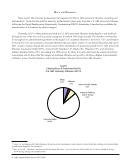
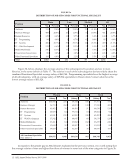
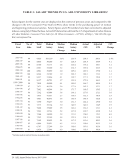
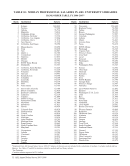
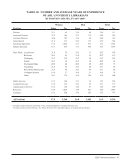
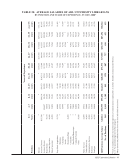
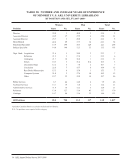
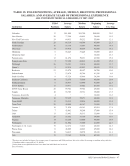
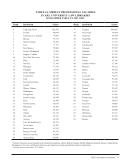
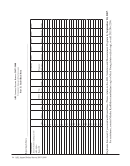
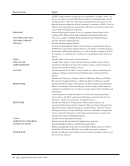
ARL University Libraries · 43 TABLE 18: NUMBER AND AVERAGE YEARS OF EXPERIENCE OF ARL UNIVERSITY LIBRARIANS BY POSITION AND SEX, FY 2007–2008* Women Men Total Position Years No. Years No. Years No. Director 32.1 62 31.9 49 32.0 111 Associate Director 25.9 166 23.3 119 24.8 285 Assistant Director 24.4 102 23.6 80 24.0 182 Head, Branch 21.8 337 22.4 167 22.0 504 Functional Specialist 13.8 1,048 12.7 915 13.2 1,963 Subject Specialist 16.1 679 17.3 395 16.6 1,074 Dept. Head: Acquisitions 21.0 74 19.2 31 20.5 105 Reference 20.3 81 21.6 31 20.7 112 Cataloging 23.2 119 23.5 44 23.2 163 Serials 20.1 24 22.5 10 20.8 34 Documents/Maps 20.0 44 20.0 29 20.0 73 Circulation 21.0 66 16.6 28 19.7 94 Rare Books/Manuscripts 22.4 44 24.3 44 23.3 88 Computer Systems 18.8 27 18.8 51 18.8 78 Other 20.1 376 19.6 228 19.9 604 Public Services 12.3 184 13.1 74 12.5 258 Technical Services 14.9 123 14.1 52 14.7 175 Administrative Services 15.4 138 14.0 51 15.0 189 Reference 14.4 1,024 14.9 421 14.6 1,445 Cataloger 17.2 530 17.6 243 17.3 773 All Positions 17.0 5,248 16.8 3,062 16.9 8,310 * Includes Canadian libraries. See Table 33 for comparable figures in Canadian libraries only. Excludes medical and law libraries. See Tables 40 and 47 for comparable figures in medical and law libraries.
Help