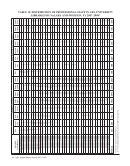
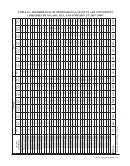
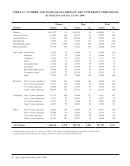
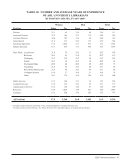
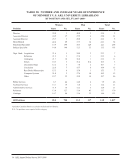
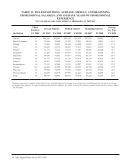
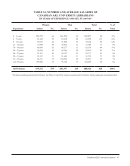
Table 16: Distribution of Professional Staff in ARL University Libraries by Salary, Sex, and Position, FY 2007–2008. ...............................................................................41 Table 17: Number and Average Salaries of ARL University Librarians by Position and Sex, FY 2007–2008. ............................................................................................42 Table 18: Number and Average Years of Experience of ARL University Librarians by Position and Sex, FY 2007–2008. ............................................................................................43 Table 19: Number and Average Salaries of ARL University Librarians by Years of Experience and Sex, FY 2007–2008. .........................................................................44 Table 20: Average Salaries of ARL University Librarians by Position and Years of Experience, FY 2007–2008. ..................................................................45 Table 21: Number and Average Salaries of ARL University Librarians by Position and Type of Institution, FY 2007–2008......................................................................46 Table 22: Years of Experience of ARL University Librarians by Position and Type of Institution, FY 2007–2008......................................................................47 Table 23: Number and Average Salaries of ARL University Librarians by Position and Size of Professional Staff, FY 2007–2008...........................................................48 Table 24: Years of Experience of ARL University Librarians by Position and Size of Professional Staff, FY 2007–2008...........................................................49 Table 25: Average Salaries of ARL University Librarians by Position and Geographic Region, FY 2007–2008. ...................................................................50 ARL University Libraries by Geographic Region.........................................................................51 U.S. ARL UNIVERSITY LIBRARIES Table 26: Average Salaries of U.S. ARL University Librarians by Position and Years of Experience, FY 2007–2008. ..................................................................54 Table 27: Number and Average Salaries of Minority U.S. ARL University Librarians by Position and Sex, FY 2007–2008. ............................................................................................55 Table 28: Number and Average Years of Experience of Minority U.S. ARL University Librarians by Position and Sex, FY 2007–2008............................................................................56 Table 29: Number and Average Salaries of U.S. ARL University Librarians by Years of Experience and Sex, FY 2007–2008. .........................................................................57 Table 30: Number and Average Salaries of Minority U.S. ARL University Librarians by Years of Experience and Sex, FY 2007–2008. .........................................................................57
Help