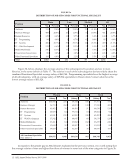
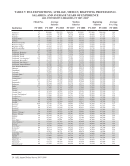
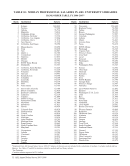
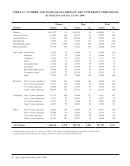
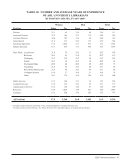
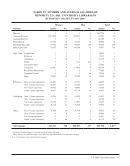
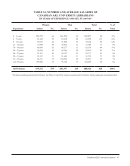
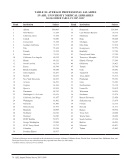
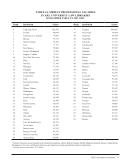
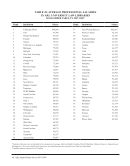
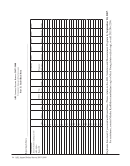
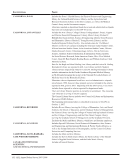
38 · ARL Annual Salary Survey 2007–2008 TABLE 14: AVERAGE, MEDIAN, AND BEGINNING PROFESSIONAL SALARIES IN ARL UNIVERSITY LIBRARIES SUMMARY OF RANKINGS, FYs 2004–2005 TO 2007–2008* Institution Average Salaries Median Salaries Beginning Salaries FY 2005 2006 2007 2008 2005 2006 2007 2008 2005 2006 2007 2008 Rutgers 4 5 1 1 4 2 1 1 62 7 16 13 Saskatchewan 68 65 31 12 58 52 25 10 106 105 102 53 South Carolina 98 104 108 110 102 108 106 109 85 99 108 111 Southern California 17 2 21 22 24 19 33 33 3 5 11 16 Southern Illinois 76 92 100 105 94 106 107 107 35 44 61 58 SUNY Albany 72 81 80 77 54 64 68 77 52 64 72 94 SUNY Buffalo 81 80 81 58 84 82 84 52 36 49 11 16 SUNY Stony Brook 11 22 22 24 13 20 19 25 14 24 27 34 Syracuse 50 61 58 53 72 78 74 67 73 79 113 N/A Temple 86 67 46 45 92 84 57 78 85 76 75 86 Tennessee 36 43 45 32 42 51 34 30 60 28 45 44 Texas 41 51 57 64 55 72 67 73 36 28 17 16 Texas A&M 79 88 92 79 91 93 96 85 17 28 27 27 Texas Tech 94 99 106 81 101 105 105 94 36 51 75 16 Toronto 49 27 4 8 17 12 2 6 93 75 34 33 Tulane 83 89 73 87 77 80 60 80 85 99 84 100 Utah 93 94 90 80 93 96 91 88 55 51 45 44 Vanderbilt 100 91 89 94 99 92 95 97 85 79 75 86 Virginia 47 33 33 36 40 28 35 58 29 28 35 34 Virginia Tech 70 75 74 67 65 55 70 61 73 51 84 91 Washington 48 59 70 63 56 70 75 70 36 48 45 58 Washington State 88 62 79 91 79 44 77 89 95 68 81 94 Washington U.-St. Louis 59 64 84 93 88 89 90 99 55 68 84 100 Waterloo 89 69 30 31 63 29 16 17 109 104 63 52 Wayne State 32 107 103 109 67 110 109 110 29 79 45 67 Western Ontario 112 111 95 88 108 107 98 91 92 67 40 65 Wisconsin 61 71 66 83 52 62 58 74 57 63 62 84 Yale 3 10 3 6 11 27 13 15 6 27 4 3 York 23 9 6 2 16 14 12 7 104 102 97 32 * Excludes medical and law libraries. † Not a member during this year.
Help