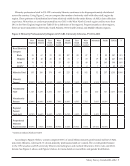
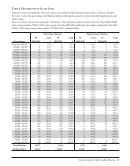
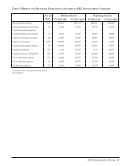
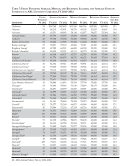
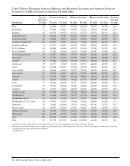
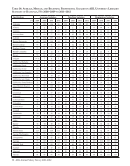
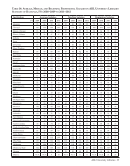
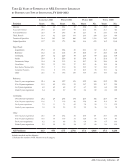
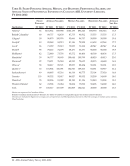
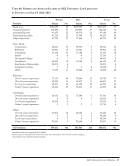
ARL University Law Libraries · 79 Table 42: Filled Positions Average, Median, and Beginning Salaries and Average Years of Experience in ARL University Law Libraries, FY 2011–2012 Institution Filled Positions Average Salary Median Salary Beginning Salary Average Yrs. Exp. New Mexico 8 69,996 69,760 50,000 13.6 New York 19 81,352 77,686 60,000 23.6 North Carolina 12 68,735 65,268 57,000 16.2 Northwestern 10 64,948 60,598 50,000 22.8 Notre Dame 14 72,110 67,825 44,000 19.1 Ohio State 7 67,788 59,993 46,000 11.7 Oklahoma 7 59,551 52,852 42,000 16.9 Oregon 7 57,483 55,923 42,000 16.4 Ottawa 3 ‡ ‡ 50,111 23.7 Pennsylvania 14 69,684 67,800 45,000 17.3 Pennsylvania State 9 71,808 69,586 57,000 21.7 Queen’s 3 ‡ ‡ 53,842 11.7 Rutgers – Newark 6 69,919 79,773 62,000 19.2 Rutgers – Camden 8 80,884 68,983 67,500 22.1 Saskatchewan 2 ‡ ‡ 57,839 19.0 South Carolina 8 66,342 67,750 50,000 18.8 Southern Illinois 4 ‡ ‡ 50,000 8.0 Suny–Buffalo 10 72,770 72,791 55,000 16.3 Syracuse 10 58,823 55,631 46,700 15.4 Temple 10 63,848 53,203 43,500 25.1 Tennessee 8 58,966 55,998 45,000 12.0 Texas 14 67,223 57,057 42,000 16.1 Texas Tech 8 60,073 56,312 50,000 10.0 Toronto 6 90,595 95,584 54,524 13.8 Tulane 8 62,911 60,940 45,000 17.1 Utah 8 56,402 52,530 41,500 18.5 Vanderbilt 5 69,663 61,994 41,500 18.8 Virginia 13 70,592 64,650 63,500 16.9 Washington 16 71,318 65,496 61,000 22.5 Washington U.–St. Louis 10 65,037 60,409 50,000 20.9 Wayne State 5 61,830 57,360 45,600 20.2 Western Ontario 3 ‡ ‡ 53,925 16.3 Wisconsin 12 67,501 63,725 40,526 25.1 Yale 20 85,636 78,000 49,500 17.0 York 5 97,812 101,244 48,931 17.2 Directors are included in figures for filled positions and average years of experience, but not in either the average or median salary statistics. Canadian salaries are expressed in US dollars. ‡ Salary data are not published when fewer than four individuals are involved.
Help