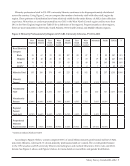
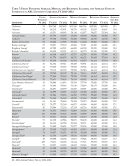
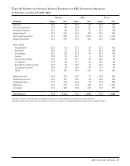
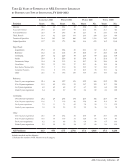
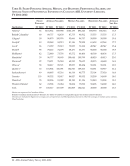
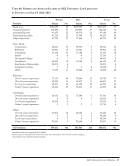
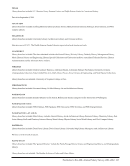
10 · ARL Annual Salary Survey 2011–2012 Figure 3: Race/Ethnicity and Sex Distribution of Professional Staff in ARL University Libraries, FY 2011–2012 United States Men Women Total Number of Staff Percent of Total Number of Staff Percent of Total Main 2,788 38.4% 4,472 61.6% 7,260 Medical 245 29.8% 576 70.2% 821 Law 247 35.2% 454 64.8% 701 Minority* 387 31.4% 846 68.6% 1,233 Non-minority 2,861 38.3% 4,616 61.7% 7,477 All 3,248 37.3% 5,462 62.7% 8,710 Canada Men Women Total Number of Staff Percent of Total Number of Staff Percent of Total Main 308 31.5% 670 68.5% 978 Medical 10 9.2% 99 90.8% 109 Law 13 31.7% 28 68.3% 41 All 331 29.3% 797 70.7% 1,128 United States and Canada (Combined) Men Women Total Number of Staff Percent of Total Number of Staff Percent of Total Main 3,096 37.6% 5,142 62.4% 8,238 Medical 255 27.4% 675 72.6% 930 Law 260 35.0% 482 65.0% 742 All 3,611 36.4% 6,299 63.6% 9,910 *Includes staff in medical and law libraries. Note: There are three US institutions that did not report race/ethnicity data therefore, the totals will not aggregate to the total needed for the US and Canadian sub-totals to equal the figure displayed in the combined total. ARL recognizes the difficulties that the profession has in attracting a diverse workforce and continues to work actively in the development of workplace climates that embrace diversity. The ARL Diversity Programs, through its Leadership and Career Development Program and the Initiative to Recruit a Diverse Workforce, emphasize ARL’s and its members’ commitment to creating a diverse academic and research library community to better meet the new challenges of global competition and changing demographics. Further, the Diversity Programs focus on issues surrounding work relationships in libraries while considering the impact of diversity on library services, interactions with library users, and the development of collections. More information about the Diversity Programs can be found at http://www.arl.org/diversity/.
Help