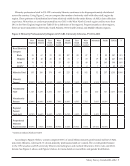
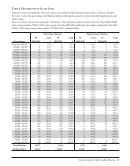
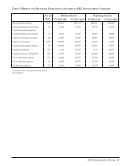
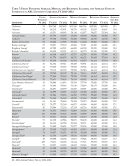
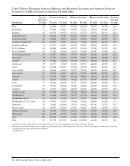
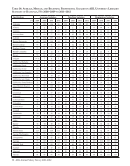
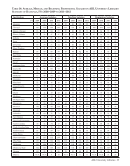
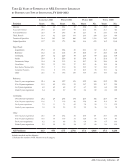
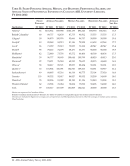
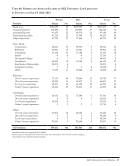
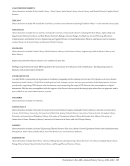
30 · ARL Annual Salary Survey 2011–2012 Table 7: Filled Positions Average, Median, and Beginning Salaries and Average Years of Experience in ARL University Libraries, FY 2011–2012 Filled Positions Average Salaries Median Salaries Beginning Salaries Average Yrs. Exp. Institution FY 2012 FY 2011 FY 2012 FY 2011 FY 2012 FY 2011 FY 2012 FY 2012 Rice 59 65,202 65,977 60,300 60,606 38,700 39,300 16.1 Rochester‡ 67 59,814 60,443 56,059 57,633 38,983 40,000 16.5 Rutgers‡ 85 91,176 90,975 91,751 91,735 50,765 50,765 23.0 Saskatchewan‡ 49 85,160 95,083 81,582 90,648 52,202 57,839 16.8 South Carolina‡ 47 52,032 53,874 48,627 50,852 38,000 38,000 15.6 Southern California‡ 109 76,057 78,811 69,761 71,282 48,500 48,500 19.9 Southern Illinois 31 59,157 60,429 56,912 58,032 44,000 44,000 15.6 SUNY Albany‡ 64 64,024 61,846 62,729 59,344 39,350 39,350 16.9 SUNY Buffalo‡ 63 75,265 78,098 70,554 75,000 47,000 47,000 21.4 SUNY Stony Brook‡ 19 87,447 88,464 79,599 80,895 43,000 45,000 20.6 Syracuse‡ 54 67,893 69,794 61,390 62,617 38,000 38,000 18.5 Temple‡ 39 69,082 70,498 60,048 61,978 44,004 44,044 20.1 Tennessee‡ 39 68,677 71,349 67,268 68,576 44,000 48,000 17.8 Texas‡ 118 66,964 65,075 59,304 58,000 45,000 46,000 16.0 Texas A&M‡ 98 64,966 63,266 59,055 58,092 48,500 48,500 14.7 Texas Tech‡ 67 58,352 60,816 54,163 57,936 45,000 49,000 12.3 Toronto 155 85,574 92,487 82,254 90,405 49,451 54,524 14.0 Tulane 35 62,835 65,668 59,492 61,979 40,000 40,000 18.9 Utah 57 61,061 64,334 55,375 58,588 45,000 45,000 19.1 Vanderbilt‡ 59 59,927 62,892 55,945 58,229 41,000 41,500 19.4 Virginia‡ 68 70,351 71,422 64,600 66,600 44,000 47,500 18.1 Virginia Tech‡ 36 63,308 62,578 58,540 59,040 40,000 40,000 17.1 Washington‡ 116 65,466 64,992 58,752 58,704 42,600 42,600 19.4 Washington State‡ 40 63,512 61,505 58,172 59,019 38,500 38,500 19.1 Washington U.–St. Louis‡ 63 60,832 61,093 55,489 55,690 40,000 40,000 17.4 Waterloo‡ 35 76,645 80,968 75,974 81,042 49,110 51,732 18.3 Wayne State‡ 45 60,697 61,219 55,396 58,200 41,000 41,000 15.4 Western Ontario‡ 62 68,581 75,958 66,961 74,991 47,836 53,925 14.0 Wisconsin‡ 148 61,068 60,592 57,692 57,385 40,526 40,526 17.6 Yale‡ 184 80,642 81,448 76,365 76,930 50,500 49,500 19.4 York 59 99,770 107,159 96,446 103,896 46,419 48,931 16.5 Excludes medical and law libraries. See Tables 35 and 42 for comparable figures for medical and law libraries. Directors are included in figures for average years of experience and filled positions, but not in either the average or median salary statistics. † Canadian salaries are expressed in US dollars. ‡ See Footnotes.
Help