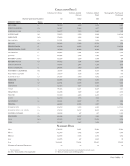
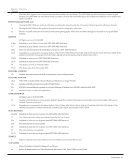
Data Tables · 27
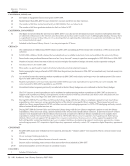
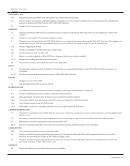
Personnel and Public Services
Library
Presentations
to Groups*
Participants
in Group
Presentations*
Reference
Transactions*
Initial
Circulation
Transactions
Total
Circulation
Transactions
Total Items
Loaned (ILL)
Total Items
Borrowed (ILL)
(29) (30) (31) (32) (33) (34) (35) (Survey Question Number)
INSTITUTION
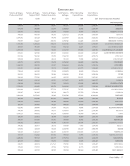
80 1,300 19,000 8,741 21,968 721 1,682 NEW YORK
148 2,643 5,038 4,275 8,305 960 434 NORTH CAROLINA
95 1,449 5,471 8,899 17,102 1,691 2,010 NORTHWESTERN
UA/NA UA/NA UA/NA 10,091 19,111 932 710 NOTRE DAME
173 1,073 4,314 11,012 50,374 396 1,083 OHIO STATE
340 1,173 1,278 2,602 2,919 92 295 OKLAHOMA
106 830 2,731 4,557 9,453 1,328 8 OREGON
353 5,551 UA/NA 9,562 12,899 734 1,132 PENNSYLVANIA
70 981 3,328 2,739 3,586 100 488 PENNSYLVANIA STATE
67 609 2,882 2,795 4,333 398 92 PITTSBURGH
35 1,504 3,939 6,751 7,477 UA/NA UA/NA QUEENS
6 180 1,426 4,143 4,378 78 355 RUTGERS-Camden
50 400 13,560 3,241 11,907 166 446 RUTGERS-Newark
14 726 1,072 8,614 11,323 143 20 SASKATCHEWAN
202 6,224 2,460 8,809 8,809 128 360 SOUTH CAROLINA
229 367 2,134 5,058 9,862 116 457 SOUTHERN CALIFORNIA
17 254 999 2,936 3,792 1,053 738 SOUTHERN ILLINOIS
123 2,121 UA/NA 6,159 12,771 957 1,258 SUNY-BUFFALO
70 1,507 10,274 3,864 6,578 280 477 SYRACUSE
66 1,067 23,850 5,592 6,292 18 UA/NA TEMPLE
UA/NA UA/NA UA/NA UA/NA UA/NA 190 69 TENNESSEE
14 202 1,143 16,171 34,426 1,427 388 TEXAS
78 1,460 3,816 10,203 12,616 434 245 TEXAS TECH
57 1,123 6,916 5,981 6,481 270 676 TULANE
260 1,422 7,453 4,725 11,478 666 993 UTAH
73 1,835 2,685 4,101 7,700 882 1,022 VANDERBILT
32 420 12,600 35,887 52,637 1,053 UA/NA VIRGINIA
142 2,219 UA/NA UA/NA 25,531 1,748 2,138 WASHINGTON
263 1,087 UA/NA 6,631 16,226 858 1,686 WASHINGTON U.-ST. LOUIS
60 490 1,983 6,735 9,761 321 UA/NA WESTERN ONTARIO
69 666 4,258 8,063 13,151 489 991 WISCONSIN
182 2,050 4,907 30,320 60,370 1,883 2,334 YALE
131 2,457 24,890 21,850 23,726 1,079 760 YORK
Summary Data
510 8,076 35,287 39,369 148,431 6,302 3,434 High
120 1,643 6,874 9,353 18,464 784 808 Mean
82 1,173 4,323 6,631 11,478 489 578 Median
1 3 999 890 1,377 3 8 Low
8,388 113,335 453,660 664,034 1,347,849 55,691 54,142 Sum
70 69 66 71 73 71 67 Number of Libraries Reporting
*Figures in italics are derived from a sampling method rather than an actual annual count.
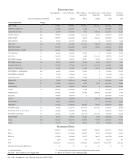
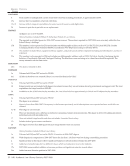
Personnel and Public Services
Library
Presentations
to Groups*
Participants
in Group
Presentations*
Reference
Transactions*
Initial
Circulation
Transactions
Total
Circulation
Transactions
Total Items
Loaned (ILL)
Total Items
Borrowed (ILL)
(29) (30) (31) (32) (33) (34) (35) (Survey Question Number)
INSTITUTION
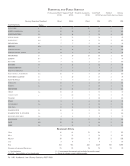
80 1,300 19,000 8,741 21,968 721 1,682 NEW YORK
148 2,643 5,038 4,275 8,305 960 434 NORTH CAROLINA
95 1,449 5,471 8,899 17,102 1,691 2,010 NORTHWESTERN
UA/NA UA/NA UA/NA 10,091 19,111 932 710 NOTRE DAME
173 1,073 4,314 11,012 50,374 396 1,083 OHIO STATE
340 1,173 1,278 2,602 2,919 92 295 OKLAHOMA
106 830 2,731 4,557 9,453 1,328 8 OREGON
353 5,551 UA/NA 9,562 12,899 734 1,132 PENNSYLVANIA
70 981 3,328 2,739 3,586 100 488 PENNSYLVANIA STATE
67 609 2,882 2,795 4,333 398 92 PITTSBURGH
35 1,504 3,939 6,751 7,477 UA/NA UA/NA QUEENS
6 180 1,426 4,143 4,378 78 355 RUTGERS-Camden
50 400 13,560 3,241 11,907 166 446 RUTGERS-Newark
14 726 1,072 8,614 11,323 143 20 SASKATCHEWAN
202 6,224 2,460 8,809 8,809 128 360 SOUTH CAROLINA
229 367 2,134 5,058 9,862 116 457 SOUTHERN CALIFORNIA
17 254 999 2,936 3,792 1,053 738 SOUTHERN ILLINOIS
123 2,121 UA/NA 6,159 12,771 957 1,258 SUNY-BUFFALO
70 1,507 10,274 3,864 6,578 280 477 SYRACUSE
66 1,067 23,850 5,592 6,292 18 UA/NA TEMPLE
UA/NA UA/NA UA/NA UA/NA UA/NA 190 69 TENNESSEE
14 202 1,143 16,171 34,426 1,427 388 TEXAS
78 1,460 3,816 10,203 12,616 434 245 TEXAS TECH
57 1,123 6,916 5,981 6,481 270 676 TULANE
260 1,422 7,453 4,725 11,478 666 993 UTAH
73 1,835 2,685 4,101 7,700 882 1,022 VANDERBILT
32 420 12,600 35,887 52,637 1,053 UA/NA VIRGINIA
142 2,219 UA/NA UA/NA 25,531 1,748 2,138 WASHINGTON
263 1,087 UA/NA 6,631 16,226 858 1,686 WASHINGTON U.-ST. LOUIS
60 490 1,983 6,735 9,761 321 UA/NA WESTERN ONTARIO
69 666 4,258 8,063 13,151 489 991 WISCONSIN
182 2,050 4,907 30,320 60,370 1,883 2,334 YALE
131 2,457 24,890 21,850 23,726 1,079 760 YORK
Summary Data
510 8,076 35,287 39,369 148,431 6,302 3,434 High
120 1,643 6,874 9,353 18,464 784 808 Mean
82 1,173 4,323 6,631 11,478 489 578 Median
1 3 999 890 1,377 3 8 Low
8,388 113,335 453,660 664,034 1,347,849 55,691 54,142 Sum
70 69 66 71 73 71 67 Number of Libraries Reporting
*Figures in italics are derived from a sampling method rather than an actual annual count.