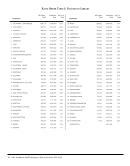
Data Tables 2011–2012 · 23
Personnel and Public Services
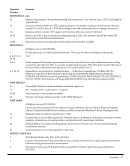
Summary Data
Summary Data
Mean
Median
High
Low
Sum
n
7,679
6,933
26,000
499
437,682
57
11,090
8,285
59,057
101
654,292
59
1,460,433
645,960
9,769,738
1,051
32,129,526
22
1,305,995
329,596
12,820,925
328
28,731,898
22
343,149
60,047
2,057,572
8,124
2,402,040
7
6,837
5,502
24,419
116
389,726
57
3,597
2,570
27,955
129
205,037
57
U
Reference
Transactions
16
Initial
Circulations
17
Full-text article
requests
18
Regular
Searches
19
Federated
Searches
20
Total Items
Loaned (ILL)
21
Total Items
Borrowed (ILL)
22
Personnel and Public Services
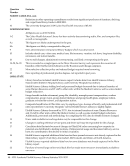
Summary Data
Summary Data
Mean
Median
High
Low
Sum
n
7,679
6,933
26,000
499
437,682
57
11,090
8,285
59,057
101
654,292
59
1,460,433
645,960
9,769,738
1,051
32,129,526
22
1,305,995
329,596
12,820,925
328
28,731,898
22
343,149
60,047
2,057,572
8,124
2,402,040
7
6,837
5,502
24,419
116
389,726
57
3,597
2,570
27,955
129
205,037
57
U
Reference
Transactions
16
Initial
Circulations
17
Full-text article
requests
18
Regular
Searches
19
Federated
Searches
20
Total Items
Loaned (ILL)
21
Total Items
Borrowed (ILL)
22