Data Tables 2011–2012 · 19
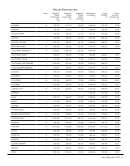
Overall Expenditures
b+
+
+
+
+
+
+
b+
b+
+
1,209,474
1,093,827
1,239,066
879,348
1,670,656
1,601,133
1,388,123
1,003,933
640,809
1,158,592
2,906,407
1,062,547
1,374,999
1,053,966
870,865
693,211
816,224
1,683,098
1,782,524
991,123
403,238
1,311,062
2,399,683
1,311,915
573,668
60,938
29,198
40,258
119,189
310,786
107,948
213,339
13,622
97,532
516,810
114,035
3,158,141
2,208,731
2,139,129
1,612,817
2,606,069
3,595,017
3,278,595
2,208,395
1,057,669
2,567,186
5,822,900
2,488,497
0
.
0
0
0
1,737
.
0
0
0
258,863
0
TEXAS TECH
TORONTO
TULANE
UTAH
VANDERBILT
VIRGINIA
WASHINGTON
WASHINGTON U.-ST. LOUIS
WESTERN
WISCONSIN
YALE
YORK
Notes Total Library
Materials
7
Total Salaries
and Wages
8
Other
Operating
Expenditures
9
Total Library
Expenditures
6
Bibl. Utilities,
Networks, etc.
External
Expenditures
12
+-See Footnotes
.-Unavailable, not applicable or no data supplied
b -Basis of volume count is bibliographic