Footnotes · 99
Question
Number
Footnote
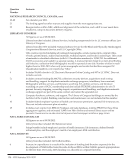
LOUISVILLE, cont.
9 The figure given for 2011–2012 has a variance of -21.1 because we discovered this year that in all
previous years fringe benefits had been included in the formula for other operating expenditures. It
will no longer be included.
10 Fringe benefits include health insurance flexible spending accounts retirement plan
program vacation, holidays, and sick leave education benefits (tuition remission for employees and
children of employees) other benefits (employee assistance, pre-paid legal services, and more), retiree
benefits, and Get Healthy Now.
12 University of Louisville payment to KYVL database access for 2011–2012 was $70,380.
13.c The -16.7 is correct because U of L Libraries spent considerably less on student wages in FY 2011–2012.
14.a The presentations are actual numbers not samplings.
15 The 55.2 variance is correct. These are actual counts (not samplings) based on Information Literacy
classes plus other group presentations. The numbers represent all UL Libraries, not just the main
library. The main library group presentation participants for FY 2011–2012 would be 17,665.
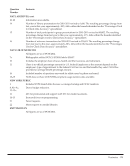
18 In summary, because we are only now beginning to systematically obtain and collate usage statistics
at this level of detail, we do not have data to pull from. What we used was our SUSHI reporting
service through Ex Libris. Some, but not all vendors allow automatic harvesting of usage statistics
via SUSHI (Standardized Usage Statistics Harvesting Initiative )that are then available to query via
a single interface. It does not work well enough for our use at this point, but did have a significant
amount of data for the relevant time period. The total number of successful full-text requests was
obtained from Ustat, and we then looked for missing platforms /publishers (again, not all are
SUSHI compliant) that are known to have substantive use. Numbers were obtained individually and
added to the number from Ustat. Some spot checking between Ustat’s numbers and numbers on
individually downloaded reports usually indicated close agreement.
19 Currently do not have a verifiable count. Plan to have for FY 2012-2013.
20 Federated search statistics based on MetaLib report only.
22 U of L Libraries borrowed fewer items for our own clientele this year we are also purchasing
requested monographs rather than borrowing from other institutions. The number is accurate.
26 This number is lower because I believe previous years used a general student enrollment figure,
which would be 22,240 this year.
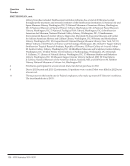
MCGILL
All figures are as of 04/30/2012.
Library branches included: Birks (religious studies), Education, Islamic Studies, Life Sciences (health,
biology), Osler (history and social sciences of medicine), Humanities and Social Sciences (includes
management), Blackader-Lauterman (art, architecture), Marvin Duchow (music), Nahum Gelber Law
Library, Rare Books and Special Collections, Schulich Library of Science and Engineering, Hitschfield
Geographic Centre, Edward Rosenthall Mathematics and Statistics Library, and Macdonald Campus
(agriculture, environmental sciences, nutrition, dietetics) Library.
Data from the Health Sciences Library are included in the figures reported.
1, 16, 24–25,
29
New measure.
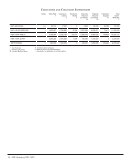
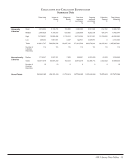
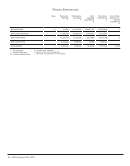
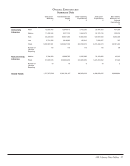
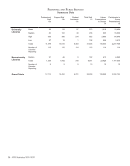
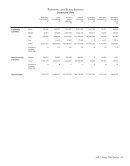
6–9, 10, 12 Expenditures as reported in Canadian dollars — Collections Expenditures: (7a) $4,942,226 (7b)
$12,201,093 (7c) $609,647 (7) $17,752,966 Salary Expenditures: (8a) $6,250,014 (8b) $5,611,681 (8c)
$257,201 (8) $12,118,896 (10) $2,115,999 Overall Expenditures: (7) $17,752,966 (8) $12,118,896 (9)
$2,417,041 (6) $32,288,903 (12) NA/UA. NOTE: Total Salaries and Wages (Q8) EXCLUDES Fringe
Benefits Expenditures (Q10).
Question
Number
Footnote
LOUISVILLE, cont.
9 The figure given for 2011–2012 has a variance of -21.1 because we discovered this year that in all
previous years fringe benefits had been included in the formula for other operating expenditures. It
will no longer be included.
10 Fringe benefits include health insurance flexible spending accounts retirement plan
program vacation, holidays, and sick leave education benefits (tuition remission for employees and
children of employees) other benefits (employee assistance, pre-paid legal services, and more), retiree
benefits, and Get Healthy Now.
12 University of Louisville payment to KYVL database access for 2011–2012 was $70,380.
13.c The -16.7 is correct because U of L Libraries spent considerably less on student wages in FY 2011–2012.
14.a The presentations are actual numbers not samplings.
15 The 55.2 variance is correct. These are actual counts (not samplings) based on Information Literacy
classes plus other group presentations. The numbers represent all UL Libraries, not just the main
library. The main library group presentation participants for FY 2011–2012 would be 17,665.
18 In summary, because we are only now beginning to systematically obtain and collate usage statistics
at this level of detail, we do not have data to pull from. What we used was our SUSHI reporting
service through Ex Libris. Some, but not all vendors allow automatic harvesting of usage statistics
via SUSHI (Standardized Usage Statistics Harvesting Initiative )that are then available to query via
a single interface. It does not work well enough for our use at this point, but did have a significant
amount of data for the relevant time period. The total number of successful full-text requests was
obtained from Ustat, and we then looked for missing platforms /publishers (again, not all are
SUSHI compliant) that are known to have substantive use. Numbers were obtained individually and
added to the number from Ustat. Some spot checking between Ustat’s numbers and numbers on
individually downloaded reports usually indicated close agreement.
19 Currently do not have a verifiable count. Plan to have for FY 2012-2013.
20 Federated search statistics based on MetaLib report only.
22 U of L Libraries borrowed fewer items for our own clientele this year we are also purchasing
requested monographs rather than borrowing from other institutions. The number is accurate.
26 This number is lower because I believe previous years used a general student enrollment figure,
which would be 22,240 this year.
MCGILL
All figures are as of 04/30/2012.
Library branches included: Birks (religious studies), Education, Islamic Studies, Life Sciences (health,
biology), Osler (history and social sciences of medicine), Humanities and Social Sciences (includes
management), Blackader-Lauterman (art, architecture), Marvin Duchow (music), Nahum Gelber Law
Library, Rare Books and Special Collections, Schulich Library of Science and Engineering, Hitschfield
Geographic Centre, Edward Rosenthall Mathematics and Statistics Library, and Macdonald Campus
(agriculture, environmental sciences, nutrition, dietetics) Library.
Data from the Health Sciences Library are included in the figures reported.
1, 16, 24–25,
29
New measure.
6–9, 10, 12 Expenditures as reported in Canadian dollars — Collections Expenditures: (7a) $4,942,226 (7b)
$12,201,093 (7c) $609,647 (7) $17,752,966 Salary Expenditures: (8a) $6,250,014 (8b) $5,611,681 (8c)
$257,201 (8) $12,118,896 (10) $2,115,999 Overall Expenditures: (7) $17,752,966 (8) $12,118,896 (9)
$2,417,041 (6) $32,288,903 (12) NA/UA. NOTE: Total Salaries and Wages (Q8) EXCLUDES Fringe
Benefits Expenditures (Q10).