120 · ARL Statistics 2011–2012
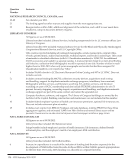
Question
Number
Footnote
TEXAS TECH, cont.
16 The increase in reference transactions reported is not only due to an increase in student enrollment
and traffic in the Library but is also due to improved compliance of recording statistics at service
desks.
26 HSC reports decrease in full-time students.
27 HSC reports decrease in part-time students.
TORONTO
All figures are as of 04/30/2012.
Library branches included: The 44 libraries of the University of Toronto Library System, plus holdings
and initial circulation data from the teaching hospital libraries in the Health Sciences Library
Consortium.
Data from the Law Library are included in the figures reported.
6–9, 10, 12 Expenditures as reported in Canadian dollars — Collections Expenditures: (7a) $12,016,653 (7b)
$15,490,380 (7c) $463,726 (7) $27,970,759 Salary Expenditures: (8a) $17,309,120 (8b) $17,431,724 (8c)
$4,284,807 (8) $39,025,651 (10) $9,155,582 Overall Expenditures: (7) $27,970,759 (8) $39,025,651 (9)
$9,049,819 (6) $76,046,229 (12) NA/UA. NOTE: Total Salaries and Wages (Q8) EXCLUDES Fringe
Benefits Expenditures (Q10).
10 Includes health plans and pension plan contributions.
18 This count is taken from 62% of our e-journal holdings.
19 This count is taken from all “heavy-use” popular databases, except PubMed and Factiva.
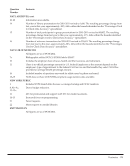
TULANE
Library branches included: Includes with the main Howard-Tilton Memorial Library, Architecture
Library, Math Library, Turchin Business Library, and Vorhoff Library at the Newcomb Center for
Research on Women.
Data from the Law and Health Sciences Libraries are included in the figures reported.
1 This figure was reported as n/a (not available) in previous years.
9 Change due to new Other Operating definition with survey questionnaire, or an interpretation
change due to changes to other expenditure definitions as well.
12 Increase primarily due to large rise in statewide consortium fees.
13.c Lower figure due to lack of increase to student budget.
23–24 Increase due to more accurate reporting and resurgence in both undergraduate and graduate
enrollment post-Katrina.
28 Last year’s figure incorrectly used FTE rather than literal full time.
UTAH
Data from the Law and Health Sciences Libraries are included in the figures reported.
1 Figure reflects Law and Health Sciences data only. Figure includes 145,406 titles from the Law Library
and 63,947 titles from the Health Sciences Library.
2 Increase resulting from a major emphasis on adding e-books to our collections.
7 Acquisitions budget increase from the University.
9 Over the last several years we spent additional funds for building and service-related items not
covered in our 2009 renovation.
Question
Number
Footnote
TEXAS TECH, cont.
16 The increase in reference transactions reported is not only due to an increase in student enrollment
and traffic in the Library but is also due to improved compliance of recording statistics at service
desks.
26 HSC reports decrease in full-time students.
27 HSC reports decrease in part-time students.
TORONTO
All figures are as of 04/30/2012.
Library branches included: The 44 libraries of the University of Toronto Library System, plus holdings
and initial circulation data from the teaching hospital libraries in the Health Sciences Library
Consortium.
Data from the Law Library are included in the figures reported.
6–9, 10, 12 Expenditures as reported in Canadian dollars — Collections Expenditures: (7a) $12,016,653 (7b)
$15,490,380 (7c) $463,726 (7) $27,970,759 Salary Expenditures: (8a) $17,309,120 (8b) $17,431,724 (8c)
$4,284,807 (8) $39,025,651 (10) $9,155,582 Overall Expenditures: (7) $27,970,759 (8) $39,025,651 (9)
$9,049,819 (6) $76,046,229 (12) NA/UA. NOTE: Total Salaries and Wages (Q8) EXCLUDES Fringe
Benefits Expenditures (Q10).
10 Includes health plans and pension plan contributions.
18 This count is taken from 62% of our e-journal holdings.
19 This count is taken from all “heavy-use” popular databases, except PubMed and Factiva.
TULANE
Library branches included: Includes with the main Howard-Tilton Memorial Library, Architecture
Library, Math Library, Turchin Business Library, and Vorhoff Library at the Newcomb Center for
Research on Women.
Data from the Law and Health Sciences Libraries are included in the figures reported.
1 This figure was reported as n/a (not available) in previous years.
9 Change due to new Other Operating definition with survey questionnaire, or an interpretation
change due to changes to other expenditure definitions as well.
12 Increase primarily due to large rise in statewide consortium fees.
13.c Lower figure due to lack of increase to student budget.
23–24 Increase due to more accurate reporting and resurgence in both undergraduate and graduate
enrollment post-Katrina.
28 Last year’s figure incorrectly used FTE rather than literal full time.
UTAH
Data from the Law and Health Sciences Libraries are included in the figures reported.
1 Figure reflects Law and Health Sciences data only. Figure includes 145,406 titles from the Law Library
and 63,947 titles from the Health Sciences Library.
2 Increase resulting from a major emphasis on adding e-books to our collections.
7 Acquisitions budget increase from the University.
9 Over the last several years we spent additional funds for building and service-related items not
covered in our 2009 renovation.