
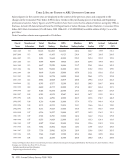
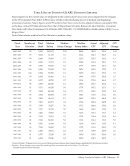
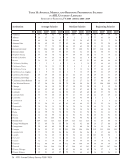
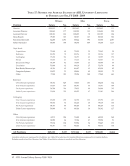
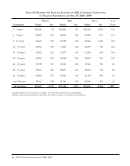
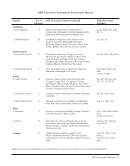
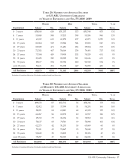
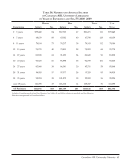
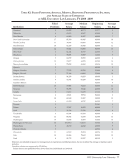
12 · ARL Annual Salary Survey 2008–2009 Figure 4: Distribution of Functional Specialist Job Sub-Codes by Type of Library Position Main Medical Law All No. Percent No. Percent No. Percent No. Percent Archivist 459 22.0% 22 14.6% 6 10.5% 487 21.2% Business Manager 132 6.3% 12 7.9% 2 3.5% 146 6.4% Human Resources 104 5.0% 1 0.7% 0 0.0% 105 4.6% IT – Programming 408 19.5% 32 21.2% 15 26.3% 455 19.8% IT – Systems 143 6.9% 18 11.9% 7 12.3% 168 7.3% IT – Web Development 269 12.9% 24 15.9% 0 0.0% 293 12.8% Media/Multimedia 110 5.3% 6 4.0% 4 7.0% 120 5.2% Preservation/Conservation 127 6.1% 1 0.7% 3 5.3% 131 5.7% Other Functional Specialists 335 16.0% 35 23.1% 20 35.1% 390 17.0% Total 2,087 151 57 2,295 *Note: The 2007–2008 version of this table contained incorrect data and has been revised. For a revised edition go to http://www.arl.org/ stats/annualsurveys/salary/annualedssal.shtml. Figure 5, below, displays the average salaries of the subcategories by position and sex in main libraries, in the same fashion as Table 17. The salaries in each of the sub-categories deviate widely from the combined Functional Specialist average salary of $63,928. Human resource specialists have the highest average of all subcategories, with an average salary of $73,090 media/multimedia specialists have the lowest average salary of $53,792. Figure 5: Distribution of Functional Specialist Job Sub-Codes’ Average Salaries by Sex Position Women Men Total Salary No. Salary No. Salary No. Archivist $57,605 290 $61,830 169 $59,160 459 Business Manager 68,834 80 73,035 52 70,489 132 Human Resources 72,464 86 76,080 18 73,090 104 IT – Programming 66,700 141 65,009 267 65,593 408 IT – Systems 62,047 67 63,819 76 62,989 143 IT – Web Development 66,235 70 67,909 199 67,473 269 Media/Multimedia 55,815 44 52,444 66 53,792 110 Preservation/Conservation 60,664 93 65,900 34 62,066 127 Other Functional Specialists 60,052 220 61,951 115 60,704 335 All Functional Specialists $63,380 1,091 $65,331 996 $63,928 2,087 In regards to the gender gap in ARL libraries explained in the previous section, it is worth noting that the average salaries of men are higher than those of women in seven out of the nine categories in Figure 5.
ARL Annual Salary Survey 2008–2009 Page 12 (12 of 120)


Powered by Tizra® |
Extracted Text (may have errors)
12 · ARL Annual Salary Survey 2008–2009 Figure 4: Distribution of Functional Specialist Job Sub-Codes by Type of Library Position Main Medical Law All No. Percent No. Percent No. Percent No. Percent Archivist 459 22.0% 22 14.6% 6 10.5% 487 21.2% Business Manager 132 6.3% 12 7.9% 2 3.5% 146 6.4% Human Resources 104 5.0% 1 0.7% 0 0.0% 105 4.6% IT – Programming 408 19.5% 32 21.2% 15 26.3% 455 19.8% IT – Systems 143 6.9% 18 11.9% 7 12.3% 168 7.3% IT – Web Development 269 12.9% 24 15.9% 0 0.0% 293 12.8% Media/Multimedia 110 5.3% 6 4.0% 4 7.0% 120 5.2% Preservation/Conservation 127 6.1% 1 0.7% 3 5.3% 131 5.7% Other Functional Specialists 335 16.0% 35 23.1% 20 35.1% 390 17.0% Total 2,087 151 57 2,295 *Note: The 2007–2008 version of this table contained incorrect data and has been revised. For a revised edition go to http://www.arl.org/ stats/annualsurveys/salary/annualedssal.shtml. Figure 5, below, displays the average salaries of the subcategories by position and sex in main libraries, in the same fashion as Table 17. The salaries in each of the sub-categories deviate widely from the combined Functional Specialist average salary of $63,928. Human resource specialists have the highest average of all subcategories, with an average salary of $73,090 media/multimedia specialists have the lowest average salary of $53,792. Figure 5: Distribution of Functional Specialist Job Sub-Codes’ Average Salaries by Sex Position Women Men Total Salary No. Salary No. Salary No. Archivist $57,605 290 $61,830 169 $59,160 459 Business Manager 68,834 80 73,035 52 70,489 132 Human Resources 72,464 86 76,080 18 73,090 104 IT – Programming 66,700 141 65,009 267 65,593 408 IT – Systems 62,047 67 63,819 76 62,989 143 IT – Web Development 66,235 70 67,909 199 67,473 269 Media/Multimedia 55,815 44 52,444 66 53,792 110 Preservation/Conservation 60,664 93 65,900 34 62,066 127 Other Functional Specialists 60,052 220 61,951 115 60,704 335 All Functional Specialists $63,380 1,091 $65,331 996 $63,928 2,087 In regards to the gender gap in ARL libraries explained in the previous section, it is worth noting that the average salaries of men are higher than those of women in seven out of the nine categories in Figure 5.

