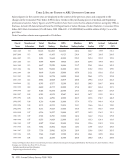
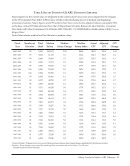
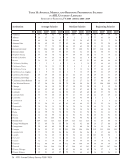
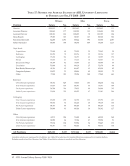
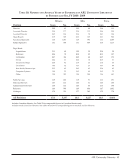
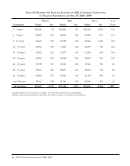
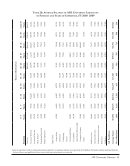
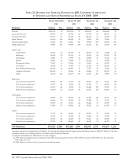
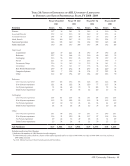
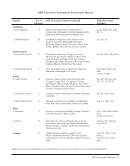
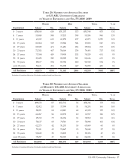
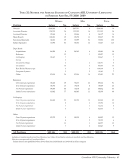
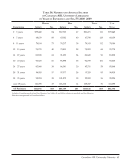
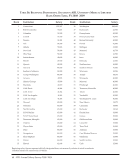
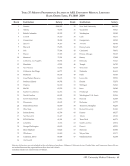
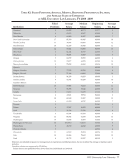
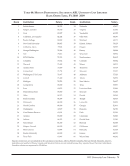
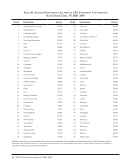
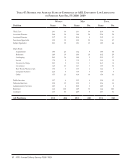
Salary Survey Trends 2008–2009 · 13 Institutional Characteristics and Salaries A. Public and Private Institutions The gap between salaries paid in private US ARL university libraries and those paid in publicly supported US university libraries increased slightly in 2008–2009 to 7% (it was 6.2 in 2007–2008) with an average of $4,778 more paid for a position in a private institution. Out of 27 job categories, only in four (Heads of Serials, Heads of Circulation, Heads of Rare Books/Manuscripts and Other department Heads) did librarians in public institutions earn more than their peers employed in private institutions (see Table 21). B. Library Size Library size, as measured by the number of professional staff, is another significant determinant of salary. As a rule, the largest libraries pay the highest average salaries, not only overall, but for specific positions as well. The cutoff staffing levels used to determine the largest cohort of libraries, after declining in every year since 1995– 1996, continued to hold steady at 110 in 2008–2009.5 The largest libraries, those with more than 110 staff, reported the highest average salary, $73,135, compared to $71,063 for the libraries with between 75 and 110 staff (see Table 23). The smallest libraries (22–49 staff) had the third-highest average salary of the cohorts, followed by those libraries with 50 to 74 staff. One factor responsible for the high pay of the smallest libraries (22–49 staff) is related to the strengthening of the Canadian dollar relative to the US dollar (see Table 4 for a list of exchange rates since 1984–1985), as 11 of the 14 Canadian ARL members have less than 74 staff. The gap between the highest paying cohort and the lowest paying cohort dropped slightly, in 2008–2009 it was $4,994, a difference of 6.83% percent (the difference in 2007-08 was $4,613 or 7%). C. Geographic Area In 2008–2009, the highest average salaries were found in Canada ($82,295) followed by the New England ($77,055) and Pacific ($74,056) regions (see Table 25). This is partly a result of the US/Canadian exchange rate, which has dropped precipitously over the past five years (see Table 4). The West South Central region had the lowest average salary, with an average of $62,286. D. Rank Structure Rank structure continues to provide a useful framework for examining professional salaries in ARL university libraries. Figure 6, below, displays average salary and years of experience in the most commonly used rank structures. Readers should be aware that not all individuals have a rank that fits into the rank structure the library utilizes. Most commonly, directors may have no rank (or a rank outside the structure) and it is common for non-librarians included in the survey (business officers, personnel staff, computer specialists, etc.) to be unranked, as well. The pattern of relationships between rank and salary seen in past years continues: with higher rank associated with higher average years of experience and a correspondingly higher salary. 6,244 of the 8,463 librarians in ARL university member libraries occupy a rank within these three most commonly found ranking systems, and the largest number of professionals (3,288) occupy a position in a four-step rank structure. 5 In 1995–1996, the largest cohort of libraries was determined based on staff over 124 in 1996–1998, over 120 in 1998–1999, over 115 and since 1999–2000, over 110. See Table 23.
Help