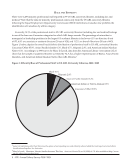
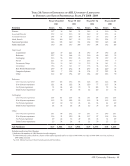
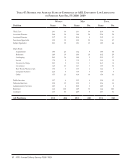
8 · ARL Annual Salary Survey 2008–2009 Race and Ethnicity There were 1,289 minority professional staff reported in 99 US ARL university libraries, including law and medical.2 Note that the data for minority professionals comes only from the US ARL university libraries following the Equal Employment Opportunity Commission (EEOC) definitions Canadian law prohibits the identification of Canadians by ethnic category. Currently, 14.1% of the professional staff in US ARL university libraries (including law and medical) belongs to one of the four non-Caucasian categories for which ARL keeps records. The percentage of minorities in managerial or leadership positions in the largest US academic libraries is far lower: 6.1% are directors (6 out of 97), 6.9% are associate or assistant directors (29 out of 420), and 11.2% are branch librarians (50 out of 443). Figure 1, below, depicts the overall racial/ethnic distribution of professional staff in US ARL university libraries: Caucasian/Other 85.9%, Asian/Pacific Islander 6.3%, Black 4.7%, Hispanic 2.8%, and American Indian/Alaskan Native 0.3%. According to a 1998 survey by Mary Jo Lynch, data from the American Library Association (ALA) show that the sample of academic libraries surveyed by ALA has a higher representation of Blacks, Asian/Pacific Islanders, and American Indian/Alaskan Native than ARL libraries.3 Figure 1: Ethnicity/Race of Professional Staff in US ARL University Libraries, 2008–2009 2 Some US institutions offer their librarians the option of not reporting race and ethnicity others forbid the tracking of racial and ethnic classification altogether. See Footnotes. 3 Mary Jo Lynch, “Librarians’ Salaries: Smaller Increases This Year,” American Libraries 29, no. 10 (1998): 66–70. Also available at http://www. ala.org/alaorg/ors/racethnc.html. Caucasian/Other 85.9% American Indian or Native Alaskan 0.3% Asian or Pacific Islander 6.3% Hispanic 2.8% Black 4.7%
Help