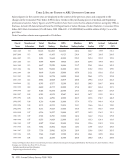
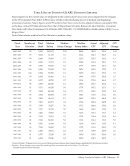
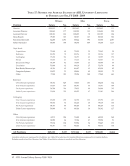
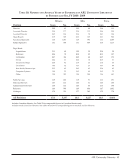
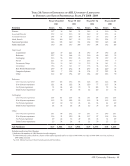
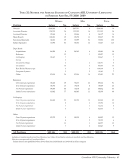
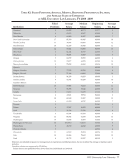
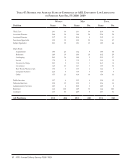
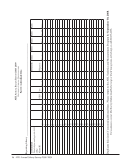
ARL University Libraries · 47 Table 22: Years of Experience of ARL University Librarians by Position and Type of Institution, FY 2008–2009 Excludes medical and law libraries. ( ) Indicates the number of ARL libraries in each category. Canadian (14) Private (31) Public (68) Total (113) Position Years No. Years No. Years No. Years No. Director 29.1 14 31.8 29 32.1 68 31.6 111 Associate Director 23.2 38 24.3 90 25.1 162 24.6 290 Assistant Director 21.9 16 24.8 72 24.0 96 24.1 184 Head, Branch 22.9 59 22.2 132 21.9 311 22.1 502 Functional Specialist 15.3 150 13.0 805 13.3 1,132 13.3 2,087 Subject Specialist 15.3 115 17.1 384 16.3 618 16.4 1,117 Dept. Head: Acquisitions 20.9 14 21.4 27 19.9 57 20.4 98 Reference 19.2 13 20.5 42 20.5 52 20.3 107 Cataloging 25.4 7 22.0 65 22.6 84 22.5 156 Serials 25.0 3 21.7 11 18.9 17 20.5 31 Documents/Maps 27.8 8 17.9 14 20.8 43 21.0 65 Circulation 18.0 13 16.4 23 19.9 53 18.7 89 Rare Books/Manuscripts 28.2 6 19.9 26 24.6 53 23.4 85 Computer Systems 19.9 7 18.7 27 18.2 38 18.5 72 Other 17.4 52 19.4 211 20.0 378 19.6 641 Reference: Over 14 years experience 25.4 91 25.7 158 24.8 363 25.1 612 10 to 14 years experience 11.9 23 12.0 52 12.0 113 12.0 188 5 to 9 years experience 6.8 65 7.3 76 7.1 172 7.1 313 Under 5 years experience 2.5 68 2.5 52 2.4 168 2.5 288 Cataloging: Over 14 years experience 28.7 35 26.0 172 26.7 204 26.6 411 10 to 14 years experience 11.8 10 11.5 39 12.1 51 11.8 100 5 to 9 years experience 6.8 8 7.0 68 6.5 60 6.7 136 Under 5 years experience 2.0 7 2.5 48 2.3 72 2.3 127 Other: Over 14 years experience 23.5 15 24.3 88 25.3 165 24.9 268 10 to 14 years experience 11.7 6 11.6 30 11.9 55 11.7 91 5 to 9 years experience 6.7 12 7.0 43 7.1 81 7.0 136 Under 5 years experience 2.4 9 2.5 56 2.2 93 2.3 158 All Positions 16.7 864 16.7 2,840 16.9 4,760 16.8 8,464
Help