Data Tables 2008–2009 · 27
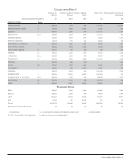
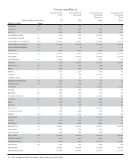
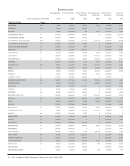
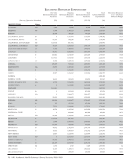
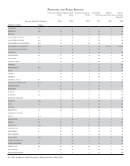
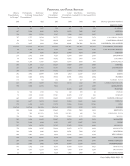
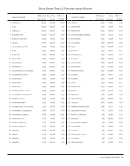
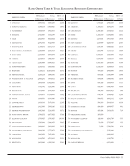
Personnel and Public Services
Library
Presentations
to Groups*
Participants
in Group
Presentations*
Reference
Transactions*
Initial
Circulation
Transactions
Total
Circulation
Transactions
Total Items
Loaned (ILL)
Total Items
Borrowed (ILL)
(30) (31) (32) (33) (34) (35) (36) (Survey Question Number)
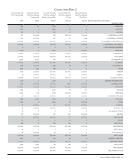
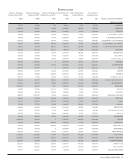
INSTITUTION
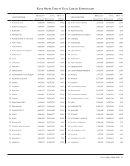
156 2,911 UA/NA 7,138 33,654 7,396 23,130 PENNSYLVANIA
118 1,486 10,772 10,582 11,292 8,999 1,341 PENNSYLVANIA STATE
363 3,005 5,375 8,284 9,011 5,082 1,834 QUEEN'S
151 1,491 7,463 4,578 6,034 4,407 4,190 ROCHESTER
195 3,285 3,115 15,000 22,742 3,644 3,063 SASKATCHEWAN
51 973 1,037 1,439 2,125 1,648 652 SOUTH CAROLINA
113 2,769 7,759 21,852 28,476 12,579 1,142 SOUTHERN CALIFORNIA
142 838 3,827 30,760 36,188 7,304 2,230 SOUTHERN ILLINOIS
173 2,298 15,036 4,823 7,273 6,300 792 SUNY-STONY BROOK
42 701 2,273 5,278 7,291 1,034 1,246 TEMPLE
288 3,951 17,992 2,183 3,561 5,236 2,215 TENNESSEE
495 4,674 17,065 29,402 75,179 5,315 2,501 TEXAS TECH
74 762 10,848 7,227 8,527 3,307 3,955 TULANE
272 2,781 48,287 34,228 35,974 9,227 10,209 UTAH
277 5,994 4,451 11,203 12,238 8,225 3,806 VANDERBILT
475 3,224 8,105 8,692 11,170 5,590 2,859 VIRGINIA
261 2,772 11,178 19,256 56,649 12,871 5,603 WASHINGTON
323 3,165 10,601 13,788 16,182 22,789 2,315 WASHINGTON U.-ST. LOUIS
237 4,145 3,484 10,535 15,525 11,732 23,467 WISCONSIN
293 4,203 8,441 UA/NA 21,487 12,309 10,554 YALE
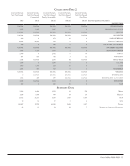
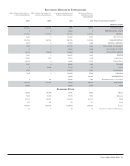
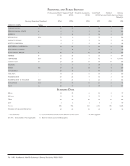
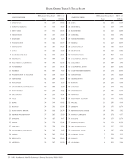
Summary Data
234 3,025 11,269 14,331 24,062 8,757 4,612 Mean
216 2,974 9,689 11,200 19,216 7,481 2,746 Median
703 8,094 48,287 71,315 115,097 41,715 25,657 High
14 182 702 339 149 176 88 Low
13,807 178,462 619,797 831,205 1,419,659 525,408 276,727 Totals
59 59 55 58 59 60 60 Number of Libraries Reporting
*Figures in italics are derived from a sampling method rather than an actual annual count.
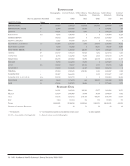
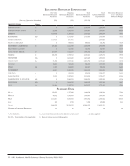
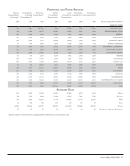
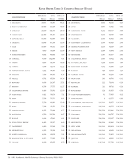
Personnel and Public Services
Library
Presentations
to Groups*
Participants
in Group
Presentations*
Reference
Transactions*
Initial
Circulation
Transactions
Total
Circulation
Transactions
Total Items
Loaned (ILL)
Total Items
Borrowed (ILL)
(30) (31) (32) (33) (34) (35) (36) (Survey Question Number)
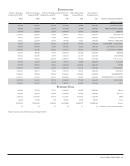
INSTITUTION
156 2,911 UA/NA 7,138 33,654 7,396 23,130 PENNSYLVANIA
118 1,486 10,772 10,582 11,292 8,999 1,341 PENNSYLVANIA STATE
363 3,005 5,375 8,284 9,011 5,082 1,834 QUEEN'S
151 1,491 7,463 4,578 6,034 4,407 4,190 ROCHESTER
195 3,285 3,115 15,000 22,742 3,644 3,063 SASKATCHEWAN
51 973 1,037 1,439 2,125 1,648 652 SOUTH CAROLINA
113 2,769 7,759 21,852 28,476 12,579 1,142 SOUTHERN CALIFORNIA
142 838 3,827 30,760 36,188 7,304 2,230 SOUTHERN ILLINOIS
173 2,298 15,036 4,823 7,273 6,300 792 SUNY-STONY BROOK
42 701 2,273 5,278 7,291 1,034 1,246 TEMPLE
288 3,951 17,992 2,183 3,561 5,236 2,215 TENNESSEE
495 4,674 17,065 29,402 75,179 5,315 2,501 TEXAS TECH
74 762 10,848 7,227 8,527 3,307 3,955 TULANE
272 2,781 48,287 34,228 35,974 9,227 10,209 UTAH
277 5,994 4,451 11,203 12,238 8,225 3,806 VANDERBILT
475 3,224 8,105 8,692 11,170 5,590 2,859 VIRGINIA
261 2,772 11,178 19,256 56,649 12,871 5,603 WASHINGTON
323 3,165 10,601 13,788 16,182 22,789 2,315 WASHINGTON U.-ST. LOUIS
237 4,145 3,484 10,535 15,525 11,732 23,467 WISCONSIN
293 4,203 8,441 UA/NA 21,487 12,309 10,554 YALE
Summary Data
234 3,025 11,269 14,331 24,062 8,757 4,612 Mean
216 2,974 9,689 11,200 19,216 7,481 2,746 Median
703 8,094 48,287 71,315 115,097 41,715 25,657 High
14 182 702 339 149 176 88 Low
13,807 178,462 619,797 831,205 1,419,659 525,408 276,727 Totals
59 59 55 58 59 60 60 Number of Libraries Reporting
*Figures in italics are derived from a sampling method rather than an actual annual count.