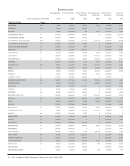
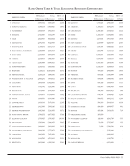
12 · ARL Academic Health Sciences Library Statistics 2008–2009
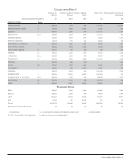
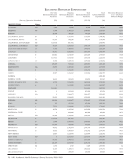
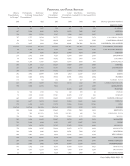
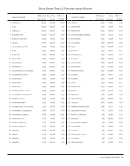
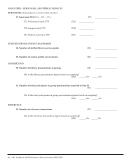
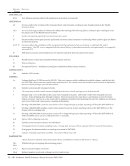
Collections Part 2
Current Serials
Total
Current Serials
Purchased
Current Serials
Purchased
Electronic
Current Serials
Purchased
Print
(Survey Question Number) (5) (5a) (5a.i) (5a.ii)
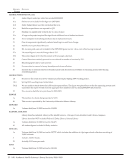
INSTITUTION Notes
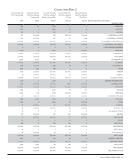
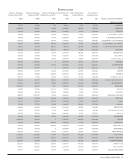
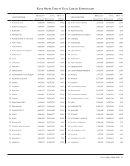
PENNSYLVANIA G 4,922 4,922 4,878 44
PENNSYLVANIA STATE b+ 7,262 5,250 5,245 5
QUEEN'S +UA/NA UA/NA UA/NA UA/NA
ROCHESTER bG+ 124 124 UA/NA 124
SASKATCHEWAN +5,530 4,840 4,735 105
SOUTH CAROLINA 30,485 3,473 3,445 28
SOUTHERN CALIFORNIA G+ 2,749 2,029 1,848 181
SOUTHERN ILLINOIS 1,152 1,152 521 631
SUNY-STONY BROOK b 4,483 1,380 1,273 107
TEMPLE b+ 7,598 5,158 4,840 318
TENNESSEE bG+ 1,787 936 752 184
TEXAS TECH b+ 22,483 20,169 19,735 434
TULANE 4,000 2,751 2,651 100
UTAH bG 3,497 1,537 1,437 100
VANDERBILT 4,410 3,156 3,113 43
VIRGINIA +UA/NA UA/NA UA/NA UA/NA
WASHINGTON +0 0 UA/NA UA/NA
WASHINGTON U.-ST. LOUIS bG+ 4,012 2,846 2,820 26
WISCONSIN bG+ 4,740 1,108 1,024 84
YALE G+ 10,407 10,118 9,618 500
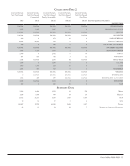
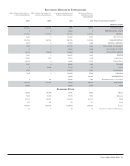
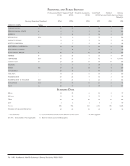
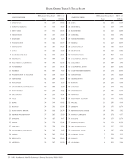
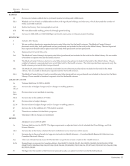
Summary Data
Mean 6,628 4,316 4,561 309
Median 4,586 2,038 2,820 142
High 30,971 30,589 29,880 2,041
Low 91 91 97 5
Totals 331,408 211,471 186,985 14,842
Number of Libraries Reporting 50 49 41 48
+– See footnotes G – Government documents not included in serials count .-no data supplied
UA/NA – Unavailable or Not Applicable b – Basis of volume count is bibliographic
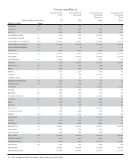
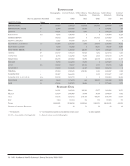
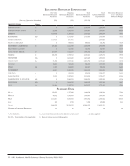
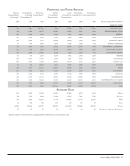
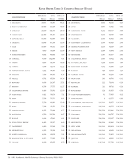
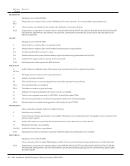
Collections Part 2
Current Serials
Total
Current Serials
Purchased
Current Serials
Purchased
Electronic
Current Serials
Purchased
(Survey Question Number) (5) (5a) (5a.i) (5a.ii)
INSTITUTION Notes
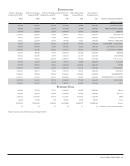
PENNSYLVANIA G 4,922 4,922 4,878 44
PENNSYLVANIA STATE b+ 7,262 5,250 5,245 5
QUEEN'S +UA/NA UA/NA UA/NA UA/NA
ROCHESTER bG+ 124 124 UA/NA 124
SASKATCHEWAN +5,530 4,840 4,735 105
SOUTH CAROLINA 30,485 3,473 3,445 28
SOUTHERN CALIFORNIA G+ 2,749 2,029 1,848 181
SOUTHERN ILLINOIS 1,152 1,152 521 631
SUNY-STONY BROOK b 4,483 1,380 1,273 107
TEMPLE b+ 7,598 5,158 4,840 318
TENNESSEE bG+ 1,787 936 752 184
TEXAS TECH b+ 22,483 20,169 19,735 434
TULANE 4,000 2,751 2,651 100
UTAH bG 3,497 1,537 1,437 100
VANDERBILT 4,410 3,156 3,113 43
VIRGINIA +UA/NA UA/NA UA/NA UA/NA
WASHINGTON +0 0 UA/NA UA/NA
WASHINGTON U.-ST. LOUIS bG+ 4,012 2,846 2,820 26
WISCONSIN bG+ 4,740 1,108 1,024 84
YALE G+ 10,407 10,118 9,618 500
Summary Data
Mean 6,628 4,316 4,561 309
Median 4,586 2,038 2,820 142
High 30,971 30,589 29,880 2,041
Low 91 91 97 5
Totals 331,408 211,471 186,985 14,842
Number of Libraries Reporting 50 49 41 48
+– See footnotes G – Government documents not included in serials count .-no data supplied
UA/NA – Unavailable or Not Applicable b – Basis of volume count is bibliographic