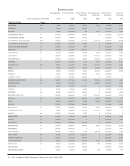
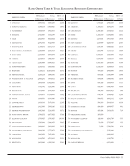
18 · ARL Academic Health Sciences Library Statistics 2008–2009
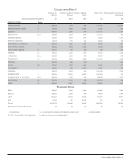
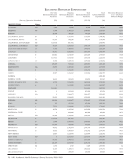
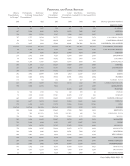
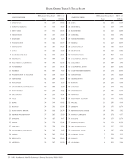
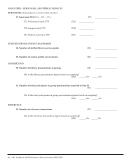
Expenditures
Monographs Current Serials Other Library
Materials
Miscellaneous
Materials
Total Library
Materials
Contract
Binding
(Survey Question Number) (16a) (16b) (16c) (16d) (16) (17)
INSTITUTION Notes
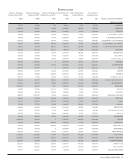
PENNSYLVANIA G 133,265 2,166,113 UA/NA UA/NA 2,299,378 1,583
PENNSYLVANIA STATE b+ 22,060 1,536,436 117,315 0 1,675,811 159
QUEEN'S +109,261 1,381,325 9,693 0 1,500,279 3,359
ROCHESTER bG+ 70,516 1,887,468 0 0 1,957,984 13,229
SASKATCHEWAN +653,614 2,024,209 0 UA/NA 2,677,823 4,695
SOUTH CAROLINA 15,827 498,849 126,716 0 641,392 0
SOUTHERN CALIFORNIA G+ 331,885 2,351,067 7,696 276,450 2,967,098 34,662
SOUTHERN ILLINOIS 76,108 732,828 0 38,251 847,187 13,887
SUNY-STONY BROOK b+ 57,285 1,476,610 140,333 8,195 1,682,423 0
TEMPLE b+ 210,717 1,693,415 567,148 7,494 2,478,774 8,416
TENNESSEE bG+ 46,554 1,744,948 53,768 4,860 1,850,130 4,755
TEXAS TECH b+ 281,735 1,878,860 51,890 421,378 2,633,863 14,305
TULANE 92,793 1,114,393 70,293 0 1,277,479 0
UTAH bG 109,212 720,817 122,336 6,373 958,738 6,496
VANDERBILT 210,010 2,610,628 46,305 39,800 2,906,743 0
VIRGINIA +159,844 1,509,651 1,511,581 3,761 3,184,837 2,108
WASHINGTON +120,807 2,666,858 .5,012 2,792,677 9,397
WASHINGTON U.-ST. LOUIS bG+ 252,128 3,030,772 0 0 3,282,900 24,998
WISCONSIN bG+ 38,610 1,176,374 664 285,932 1,501,580 29,759
YALE G+ 675,136 2,057,873 38,406 0 2,771,415 9,275
Summary Data
Mean 161,291 1,495,939 262,503 97,077 1,918,566 13,271
Median 116,179 1,502,805 53,768 19,310 1,878,193 8,132
High 675,136 3,030,772 3,141,418 458,047 4,350,544 67,835
Low 5,064 101,364 314 350 135,888 159
Totals 10,000,021 92,748,218 13,387,661 2,815,221 118,951,121 650,255
Number of Libraries Reporting 62 62 51 29 62 49
+– See footnotes G – Government documents not included in serials count .-no data supplied
UA/NA – Unavailable or Not Applicable b – Basis of volume count is bibliographic
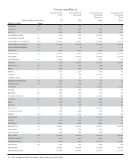
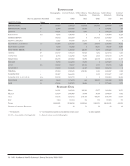
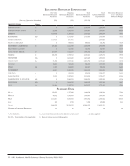
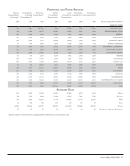
Expenditures
Monographs Current Serials Other Library
Materials
Miscellaneous
Materials
Total Library
Materials
Contract
Binding
(Survey Question Number) (16a) (16b) (16c) (16d) (16) (17)
INSTITUTION Notes
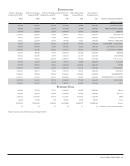
PENNSYLVANIA G 133,265 2,166,113 UA/NA UA/NA 2,299,378 1,583
PENNSYLVANIA STATE b+ 22,060 1,536,436 117,315 0 1,675,811 159
QUEEN'S +109,261 1,381,325 9,693 0 1,500,279 3,359
ROCHESTER bG+ 70,516 1,887,468 0 0 1,957,984 13,229
SASKATCHEWAN +653,614 2,024,209 0 UA/NA 2,677,823 4,695
SOUTH CAROLINA 15,827 498,849 126,716 0 641,392 0
SOUTHERN CALIFORNIA G+ 331,885 2,351,067 7,696 276,450 2,967,098 34,662
SOUTHERN ILLINOIS 76,108 732,828 0 38,251 847,187 13,887
SUNY-STONY BROOK b+ 57,285 1,476,610 140,333 8,195 1,682,423 0
TEMPLE b+ 210,717 1,693,415 567,148 7,494 2,478,774 8,416
TENNESSEE bG+ 46,554 1,744,948 53,768 4,860 1,850,130 4,755
TEXAS TECH b+ 281,735 1,878,860 51,890 421,378 2,633,863 14,305
TULANE 92,793 1,114,393 70,293 0 1,277,479 0
UTAH bG 109,212 720,817 122,336 6,373 958,738 6,496
VANDERBILT 210,010 2,610,628 46,305 39,800 2,906,743 0
VIRGINIA +159,844 1,509,651 1,511,581 3,761 3,184,837 2,108
WASHINGTON +120,807 2,666,858 .5,012 2,792,677 9,397
WASHINGTON U.-ST. LOUIS bG+ 252,128 3,030,772 0 0 3,282,900 24,998
WISCONSIN bG+ 38,610 1,176,374 664 285,932 1,501,580 29,759
YALE G+ 675,136 2,057,873 38,406 0 2,771,415 9,275
Summary Data
Mean 161,291 1,495,939 262,503 97,077 1,918,566 13,271
Median 116,179 1,502,805 53,768 19,310 1,878,193 8,132
High 675,136 3,030,772 3,141,418 458,047 4,350,544 67,835
Low 5,064 101,364 314 350 135,888 159
Totals 10,000,021 92,748,218 13,387,661 2,815,221 118,951,121 650,255
Number of Libraries Reporting 62 62 51 29 62 49
+– See footnotes G – Government documents not included in serials count .-no data supplied
UA/NA – Unavailable or Not Applicable b – Basis of volume count is bibliographic