Footnotes · 141
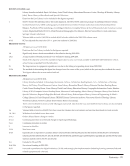
MARYLAND, cont.
16.d Includes new memberships plus increased cost of renewals.
20 Includes one-time major project costs plus expenditure of new library student technology fee.
21 One-time expenditure of $645,000 to outfit Terrapin Learning Commons.
23 Dedicated student library technology fee provided funds for increased expenditures on electronic resources.
26 Result of shift to less expensive, more efficient consortial, operating and delivery systems.
28 Counted discrete service points within libraries rather than just libraries themselves.
30 Scaling down instructional efforts. However, increases in marketing/outreach produced higher attendance.
MASSACHUSETTS
Library branches included: Science and Engineering Library, Image Collection Library.
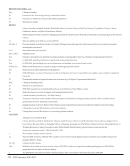
1.a Volumes held June 30, 2010 revised to 3,777,263.
1.b.i The increase in volumes added gross for 2010-2011 is part of the ebb and flow of one-time purchases for the University of
Massachusetts given our budgetary allocations and acquisition decisions in 2010-2011.
2 This is an estimate of the number of 245 fields in our ILS as of the end of 2010-2011.
5.b We are currently unable to easily distinguish between subcategories of serials received but not purchased.
10 We received the first installment of the Mark H. McCormack collection (Sports Management) during 2010-2011, which resulted in
larger than usual growth.
14 Implementation of streaming video for course reserves resulted in increased acquisition of material in DVD format.
37 Excludes 35 Ed. D., 25 Doctor of Nursing Practice, and 4 Audiology doctorates.
MIT
Library branches included: All libraries at MIT are included in the ARL Statistics.
1.a Volumes held June 30, 2010 revised to 3,343,147 by adding 223,990 to 2009-2010 figure. (This revision reflects improved
methodology for counting catalogued monographic e-resources reported in 2009-2010).
1.b Again, reflects improved methodology for counting catalogued monographic e-resources. Volumes added gross for Jun 30, 2010,
was increased as well, so that our comparisons for each year overall are valid.
3 14,204 print 595 e-books individually purchased 77,051 e-books purchased in packages. In 2009-2010, we purchased several large
packages, which contributed to the higher overall count compared to the 2010-2011 figure.
5.a.ii We have intentionally been moving from print subscriptions to electronic-only.
5.b.ii Increase in number of freely accessible serials titles due to activation of more free targets in SFX.
5.b.iii We have intentionally reduced the number of print and other formats that we accept into our collection.
16.a In addition to some budget reductions, funds were reallocated within the materials budget to produce this significant overall
drop in monograph expenditures.
16.c Backfile purchases have been a priority in recent years and even more so in 2010-2011, explaining the jump of 50.5% from 2009-
2010.
16.d This expense category was reduced due to a drop in postage costs related to print materials.
17 As a budget cutting measure, contract binding was reduced substantially in 2010-2011.
18, 18.a-18.c Includes fringe benefits.
18.b Cuts in the staffing budget resulted in the drop in expense in this category. Includes fringe benefits.
22 Some extraordinary one-time e-resource purchases were made in 2009-2010, which accounts for this substantial difference.
24.a In previous years, certain other related costs in the range of $10-$20,000 were included in this figure. For 2010-2011, we have
included only OCLC costs.
25 Figure for 2010-2011 reflects a substantial increase because it includes new expenses for video platform infrastructure.
Additionally, this was the beginning of a 5-year purchase cycle for server hardware.
27 Positions were cut in both professional and support staff categories in 2010-2011.
MARYLAND, cont.
16.d Includes new memberships plus increased cost of renewals.
20 Includes one-time major project costs plus expenditure of new library student technology fee.
21 One-time expenditure of $645,000 to outfit Terrapin Learning Commons.
23 Dedicated student library technology fee provided funds for increased expenditures on electronic resources.
26 Result of shift to less expensive, more efficient consortial, operating and delivery systems.
28 Counted discrete service points within libraries rather than just libraries themselves.
30 Scaling down instructional efforts. However, increases in marketing/outreach produced higher attendance.
MASSACHUSETTS
Library branches included: Science and Engineering Library, Image Collection Library.
1.a Volumes held June 30, 2010 revised to 3,777,263.
1.b.i The increase in volumes added gross for 2010-2011 is part of the ebb and flow of one-time purchases for the University of
Massachusetts given our budgetary allocations and acquisition decisions in 2010-2011.
2 This is an estimate of the number of 245 fields in our ILS as of the end of 2010-2011.
5.b We are currently unable to easily distinguish between subcategories of serials received but not purchased.
10 We received the first installment of the Mark H. McCormack collection (Sports Management) during 2010-2011, which resulted in
larger than usual growth.
14 Implementation of streaming video for course reserves resulted in increased acquisition of material in DVD format.
37 Excludes 35 Ed. D., 25 Doctor of Nursing Practice, and 4 Audiology doctorates.
MIT
Library branches included: All libraries at MIT are included in the ARL Statistics.
1.a Volumes held June 30, 2010 revised to 3,343,147 by adding 223,990 to 2009-2010 figure. (This revision reflects improved
methodology for counting catalogued monographic e-resources reported in 2009-2010).
1.b Again, reflects improved methodology for counting catalogued monographic e-resources. Volumes added gross for Jun 30, 2010,
was increased as well, so that our comparisons for each year overall are valid.
3 14,204 print 595 e-books individually purchased 77,051 e-books purchased in packages. In 2009-2010, we purchased several large
packages, which contributed to the higher overall count compared to the 2010-2011 figure.
5.a.ii We have intentionally been moving from print subscriptions to electronic-only.
5.b.ii Increase in number of freely accessible serials titles due to activation of more free targets in SFX.
5.b.iii We have intentionally reduced the number of print and other formats that we accept into our collection.
16.a In addition to some budget reductions, funds were reallocated within the materials budget to produce this significant overall
drop in monograph expenditures.
16.c Backfile purchases have been a priority in recent years and even more so in 2010-2011, explaining the jump of 50.5% from 2009-
2010.
16.d This expense category was reduced due to a drop in postage costs related to print materials.
17 As a budget cutting measure, contract binding was reduced substantially in 2010-2011.
18, 18.a-18.c Includes fringe benefits.
18.b Cuts in the staffing budget resulted in the drop in expense in this category. Includes fringe benefits.
22 Some extraordinary one-time e-resource purchases were made in 2009-2010, which accounts for this substantial difference.
24.a In previous years, certain other related costs in the range of $10-$20,000 were included in this figure. For 2010-2011, we have
included only OCLC costs.
25 Figure for 2010-2011 reflects a substantial increase because it includes new expenses for video platform infrastructure.
Additionally, this was the beginning of a 5-year purchase cycle for server hardware.
27 Positions were cut in both professional and support staff categories in 2010-2011.